Full Funnel Media Marketing
Budgeting and Forecasting
Reimagining enterprise budget forecasting
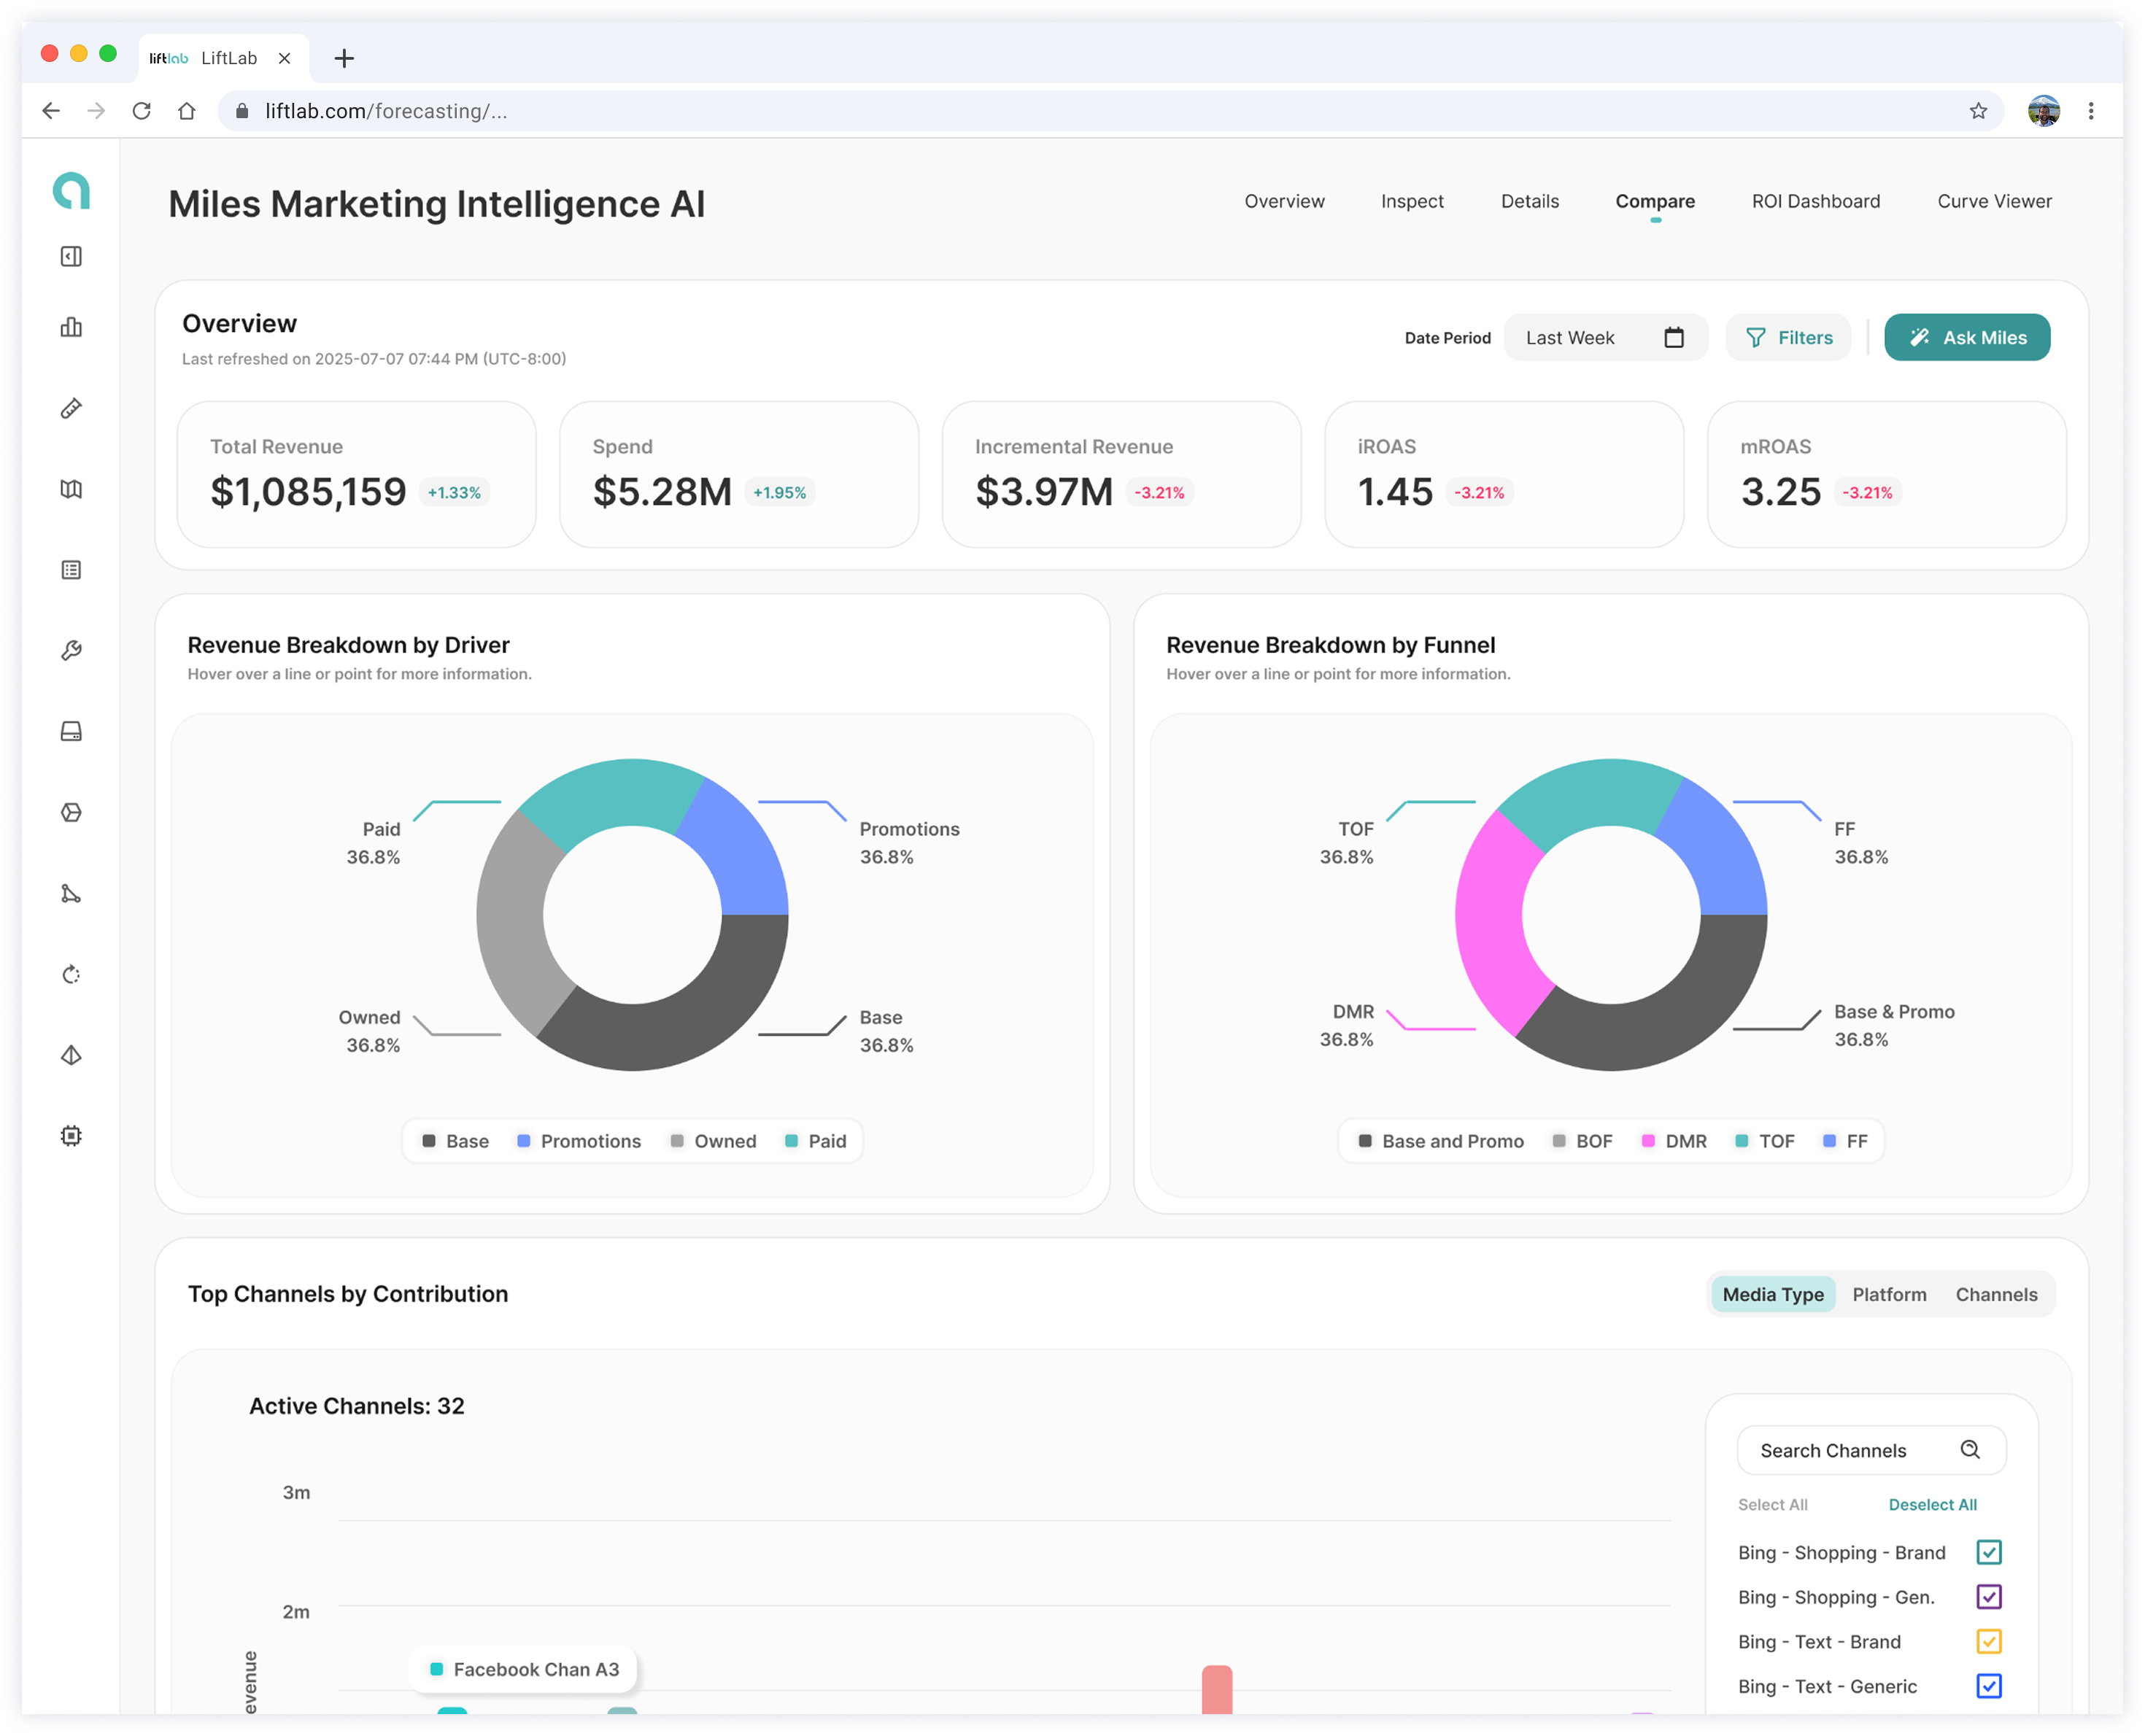
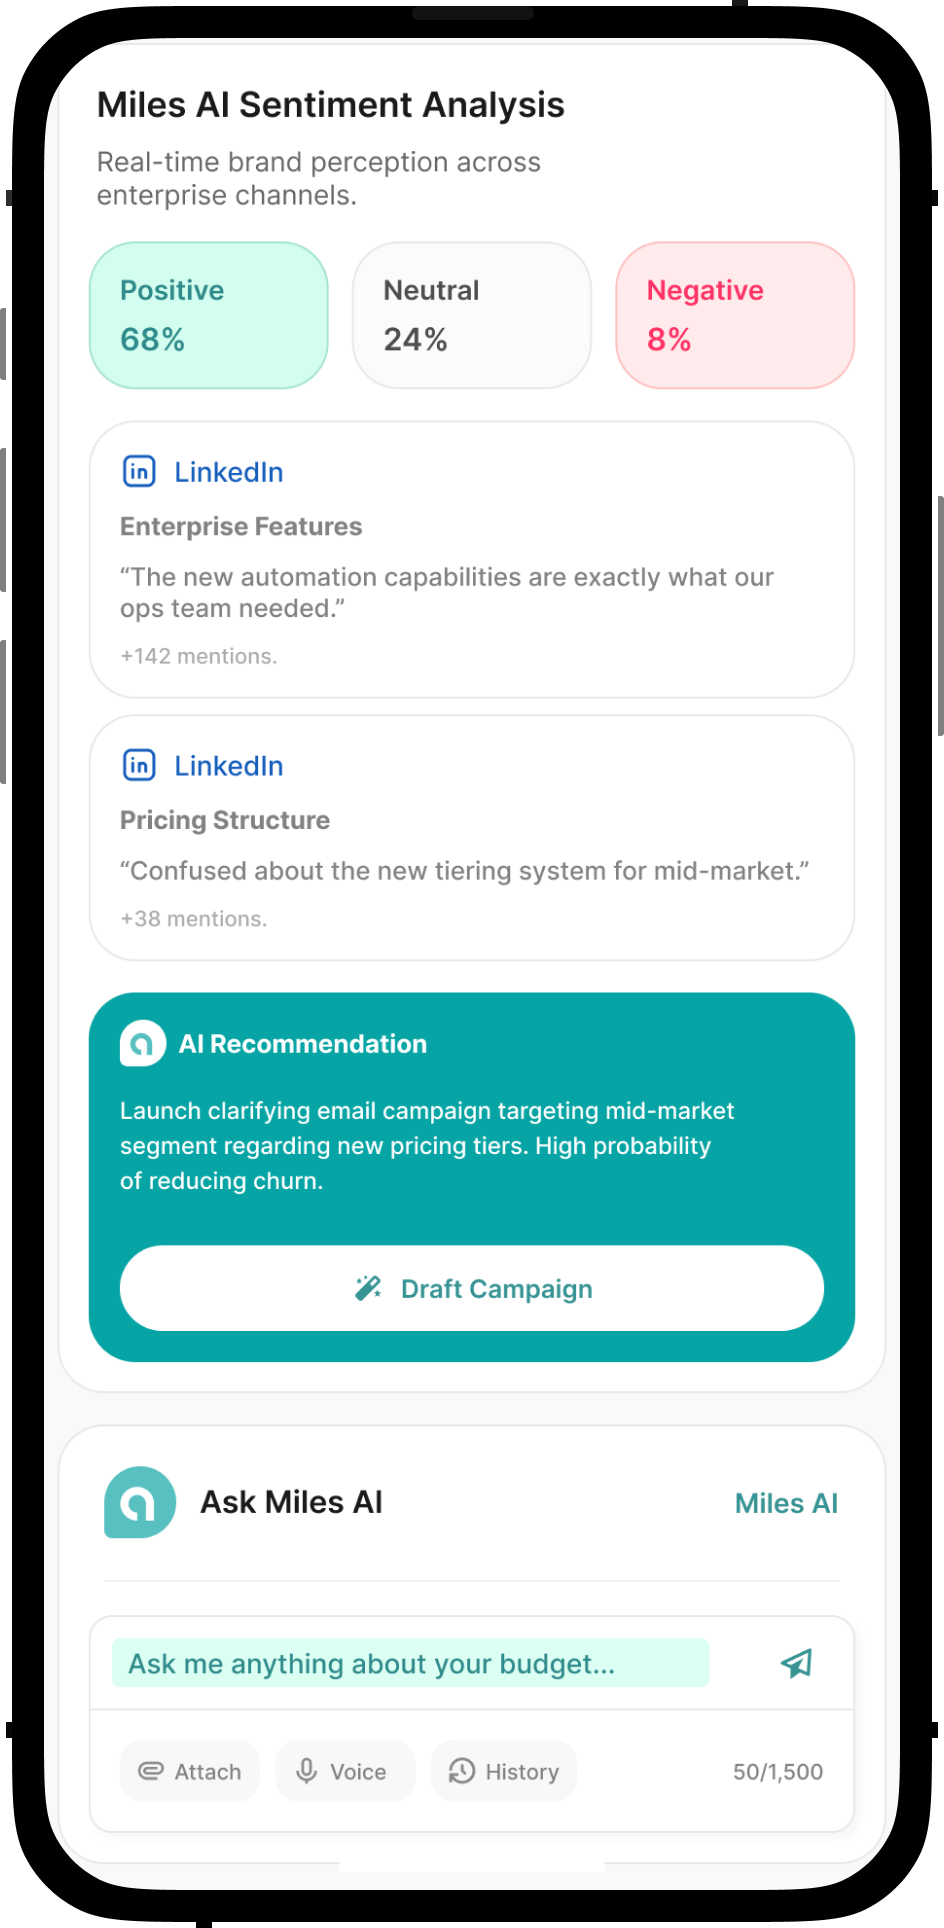
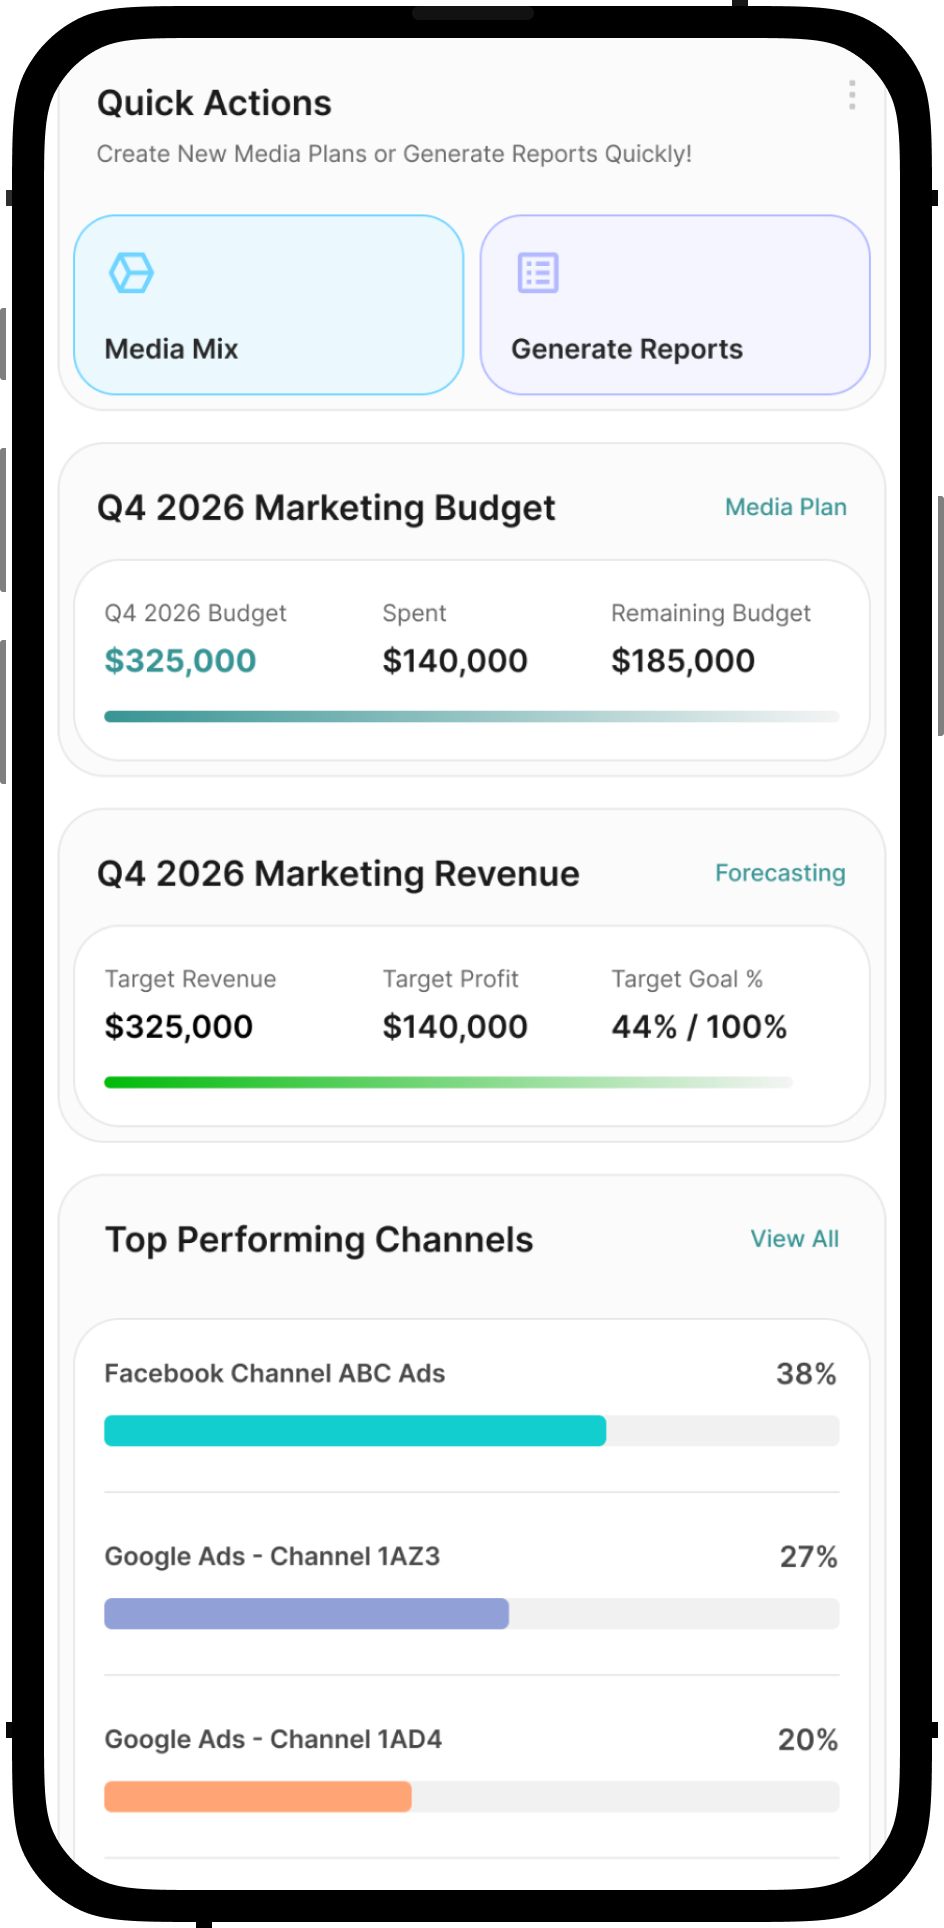
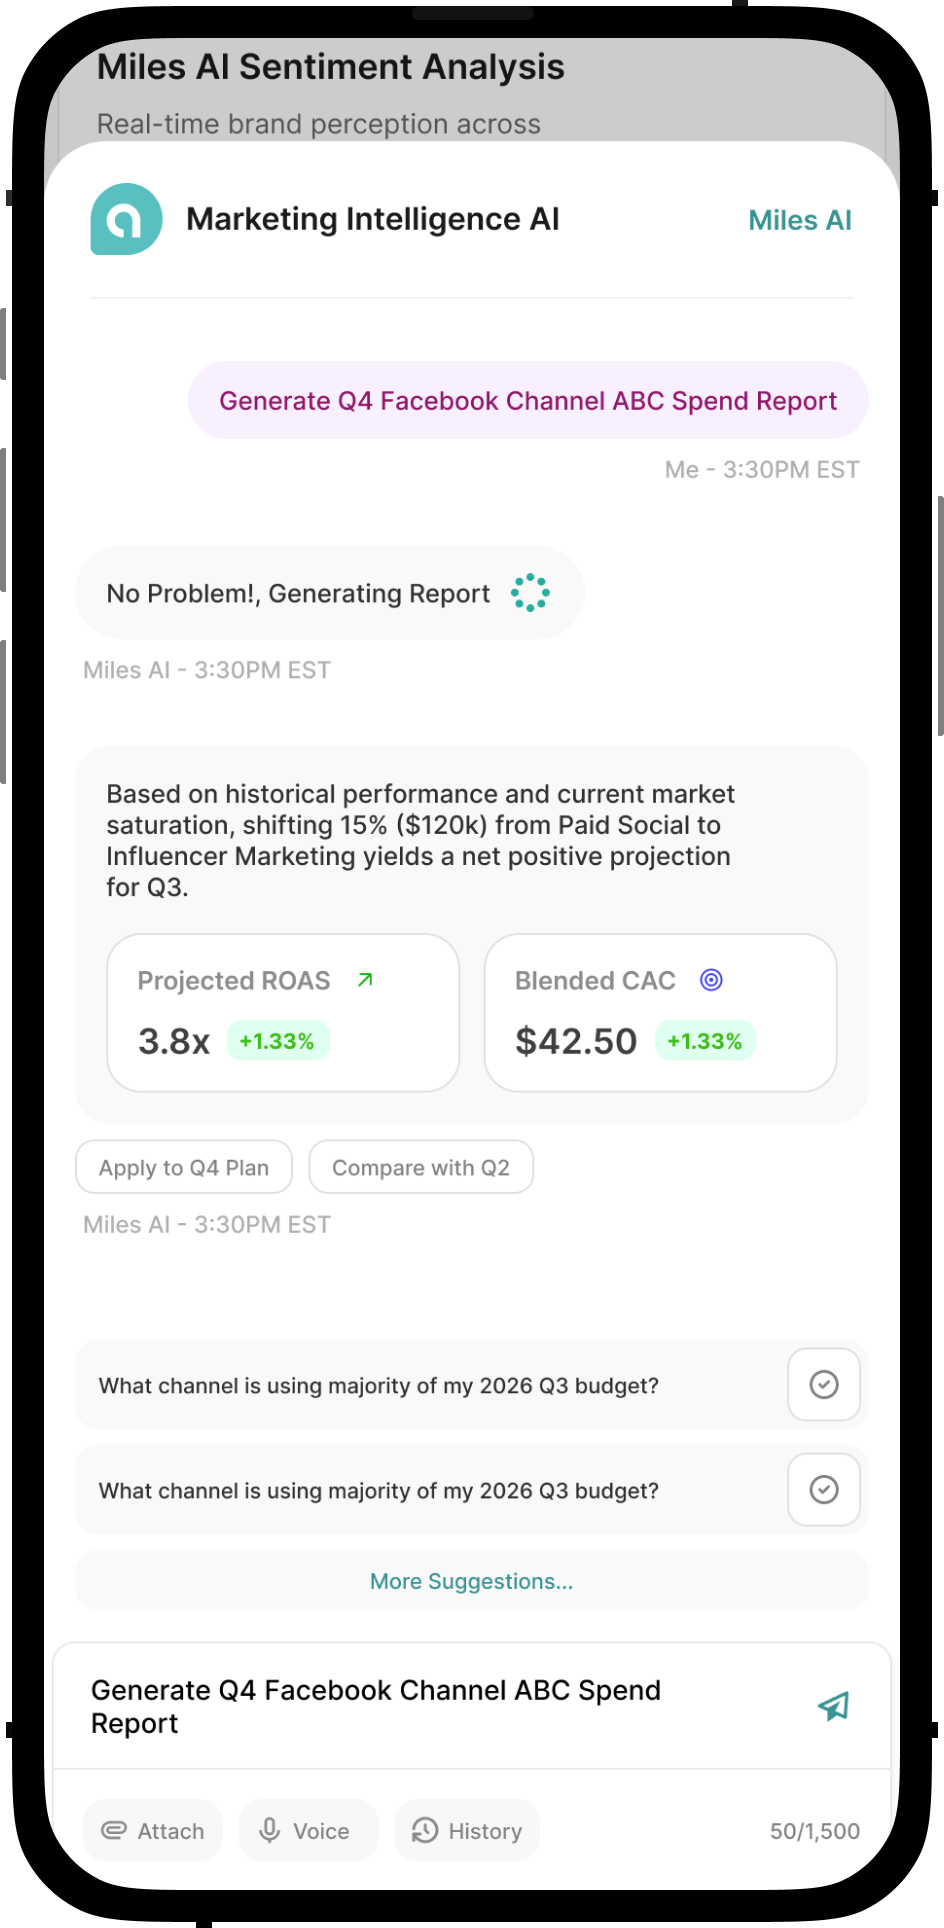
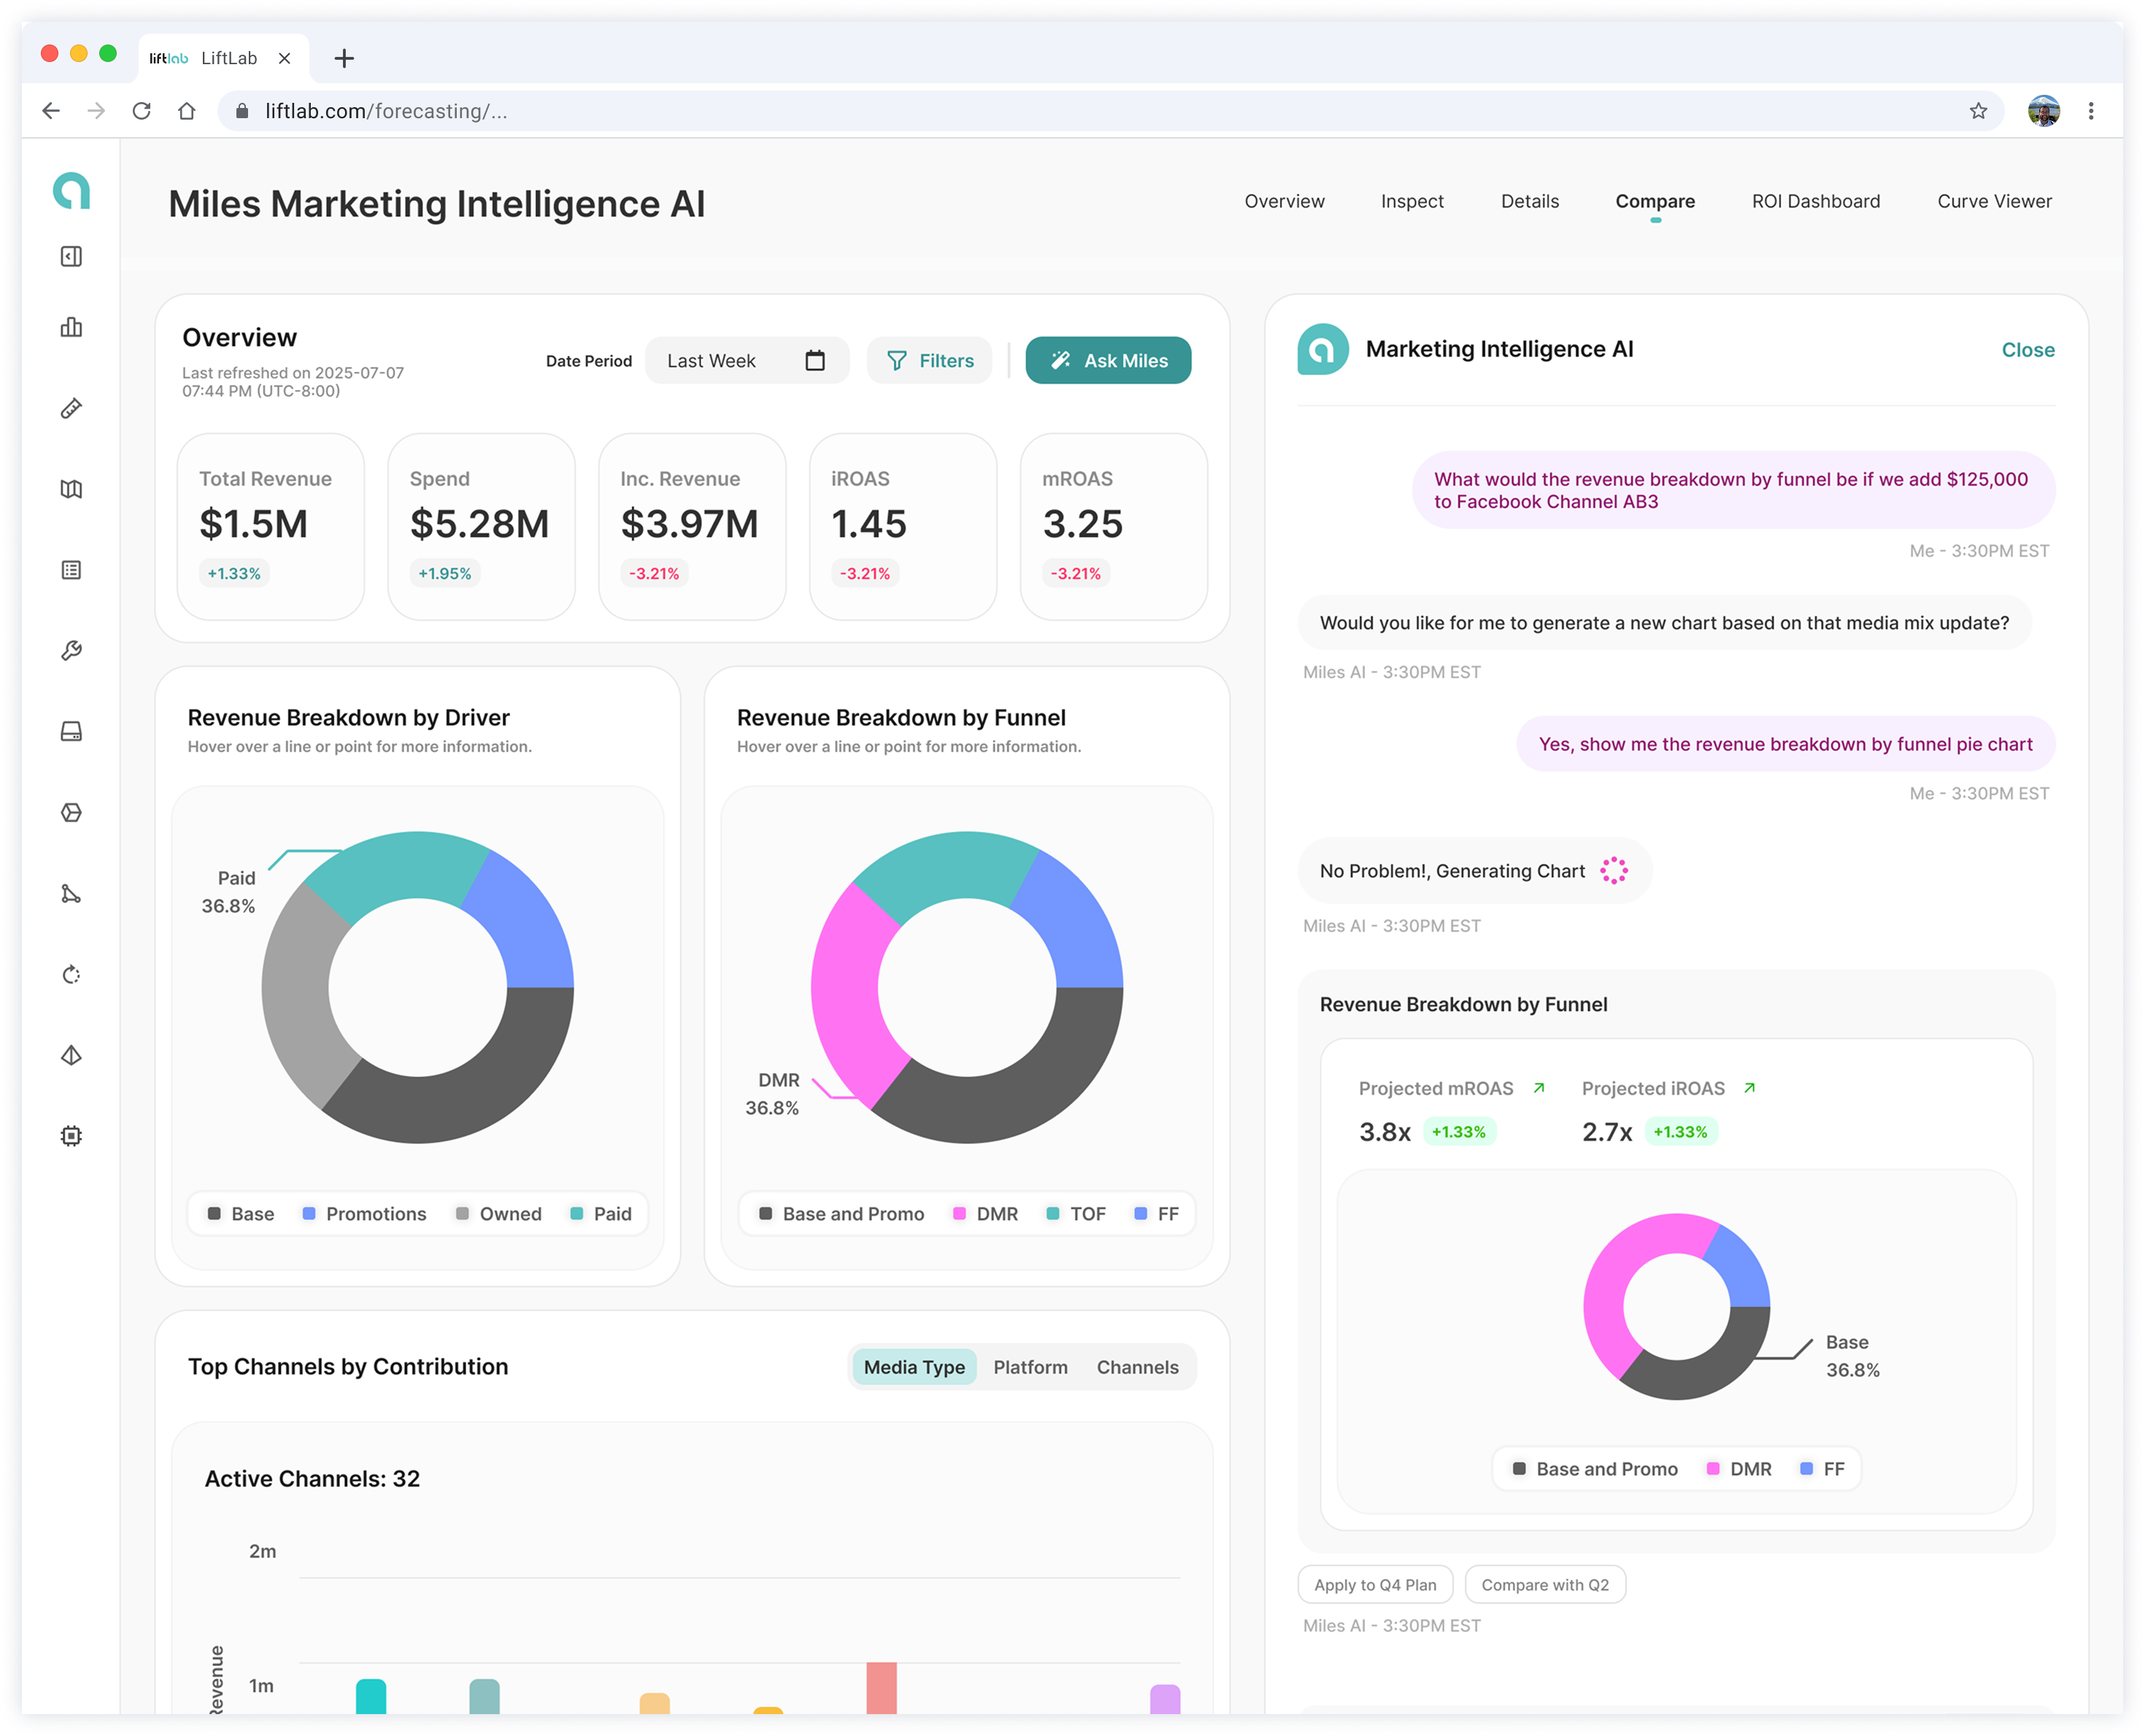
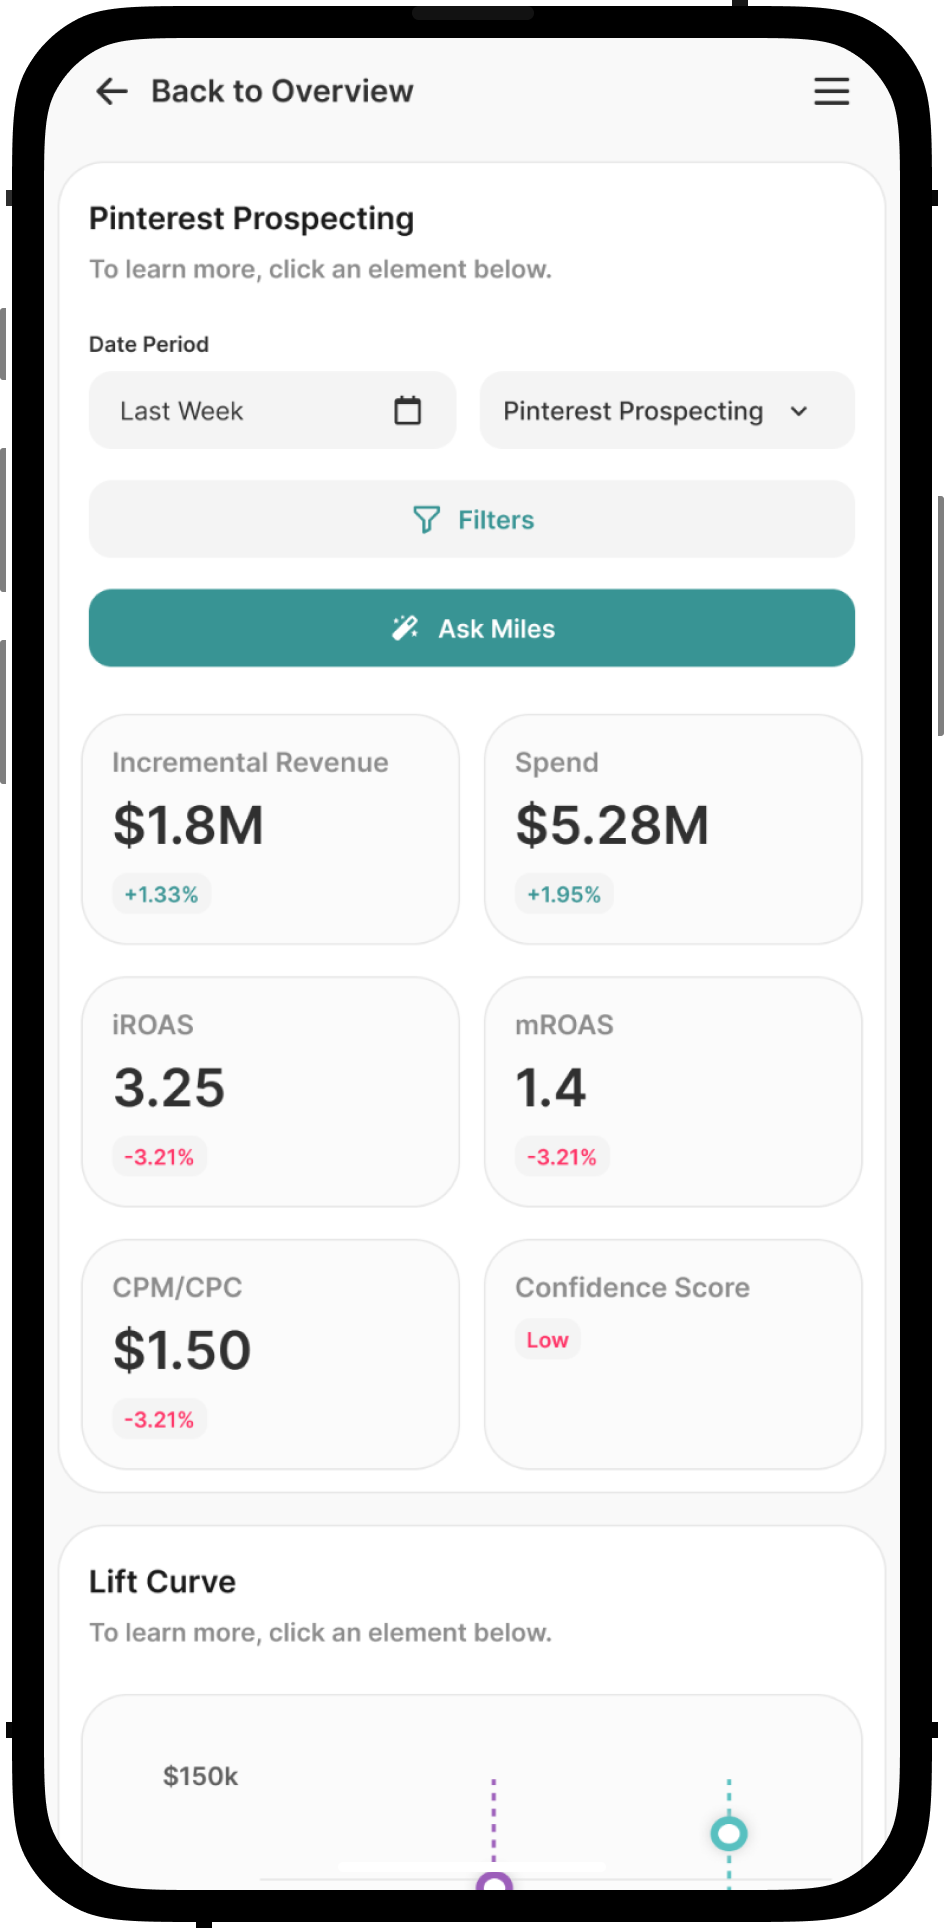
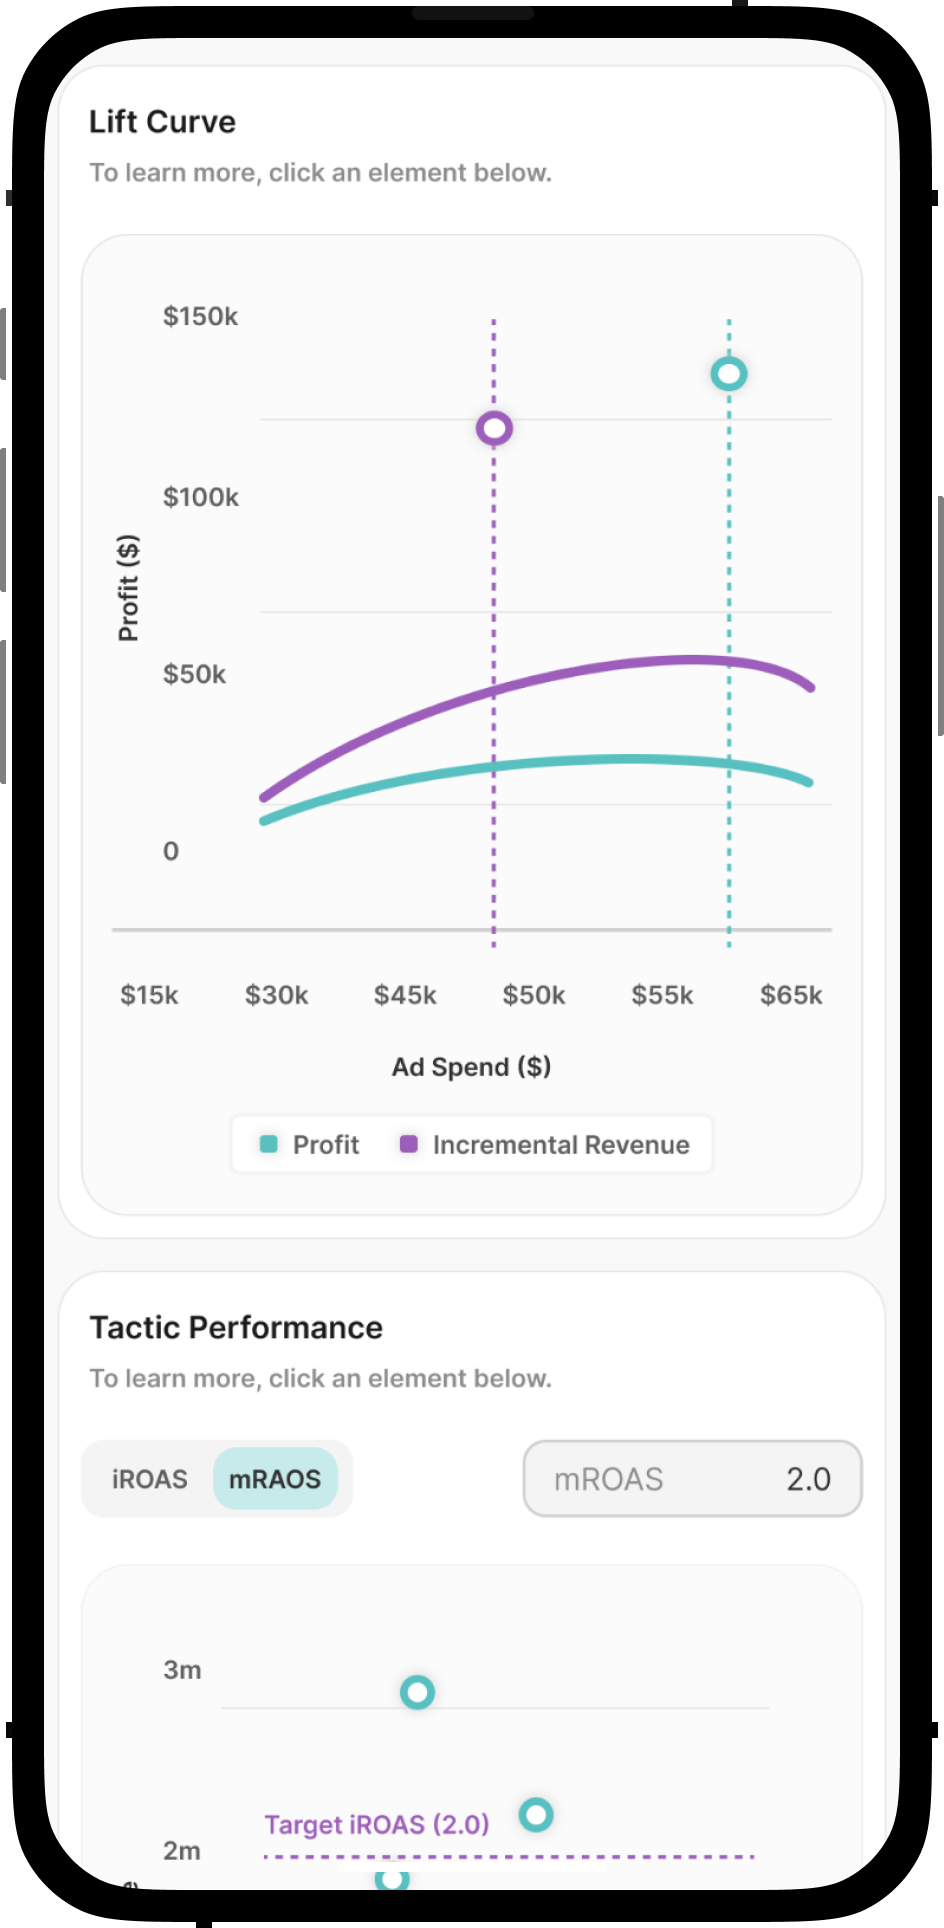
One of LiftLab's core features is a marketing budget forecasting tool that enables enterprise marketing teams to forecast their digital and print media results — profit, revenue, brand awareness, cost per clicks, customer acquisition costs, and more. The tool was built on an outdated design system. Working with the entire org, I led the redesign of the new LiftLab forecasting tool, which drove user engagement, increased forecast accuracy by 43%, reduced quarterly budget creation time by 90%, and increased ACV by 15%.
Complex, unintuitive, and hard to use
The existing forecasting application was designed several years prior and had become complex, unintuitive, and difficult to use. Power users — marketing managers, budget leads, and executives — struggled to understand the value, navigate key tasks, and trust the output. Working with CSMs, product leads, data scientists, engineers, and beta clients, I led the redesign and introduced new features across the updated LiftLab Marketing Budget Forecasting Tool.
Forecast Dashboards, Results & Optimization
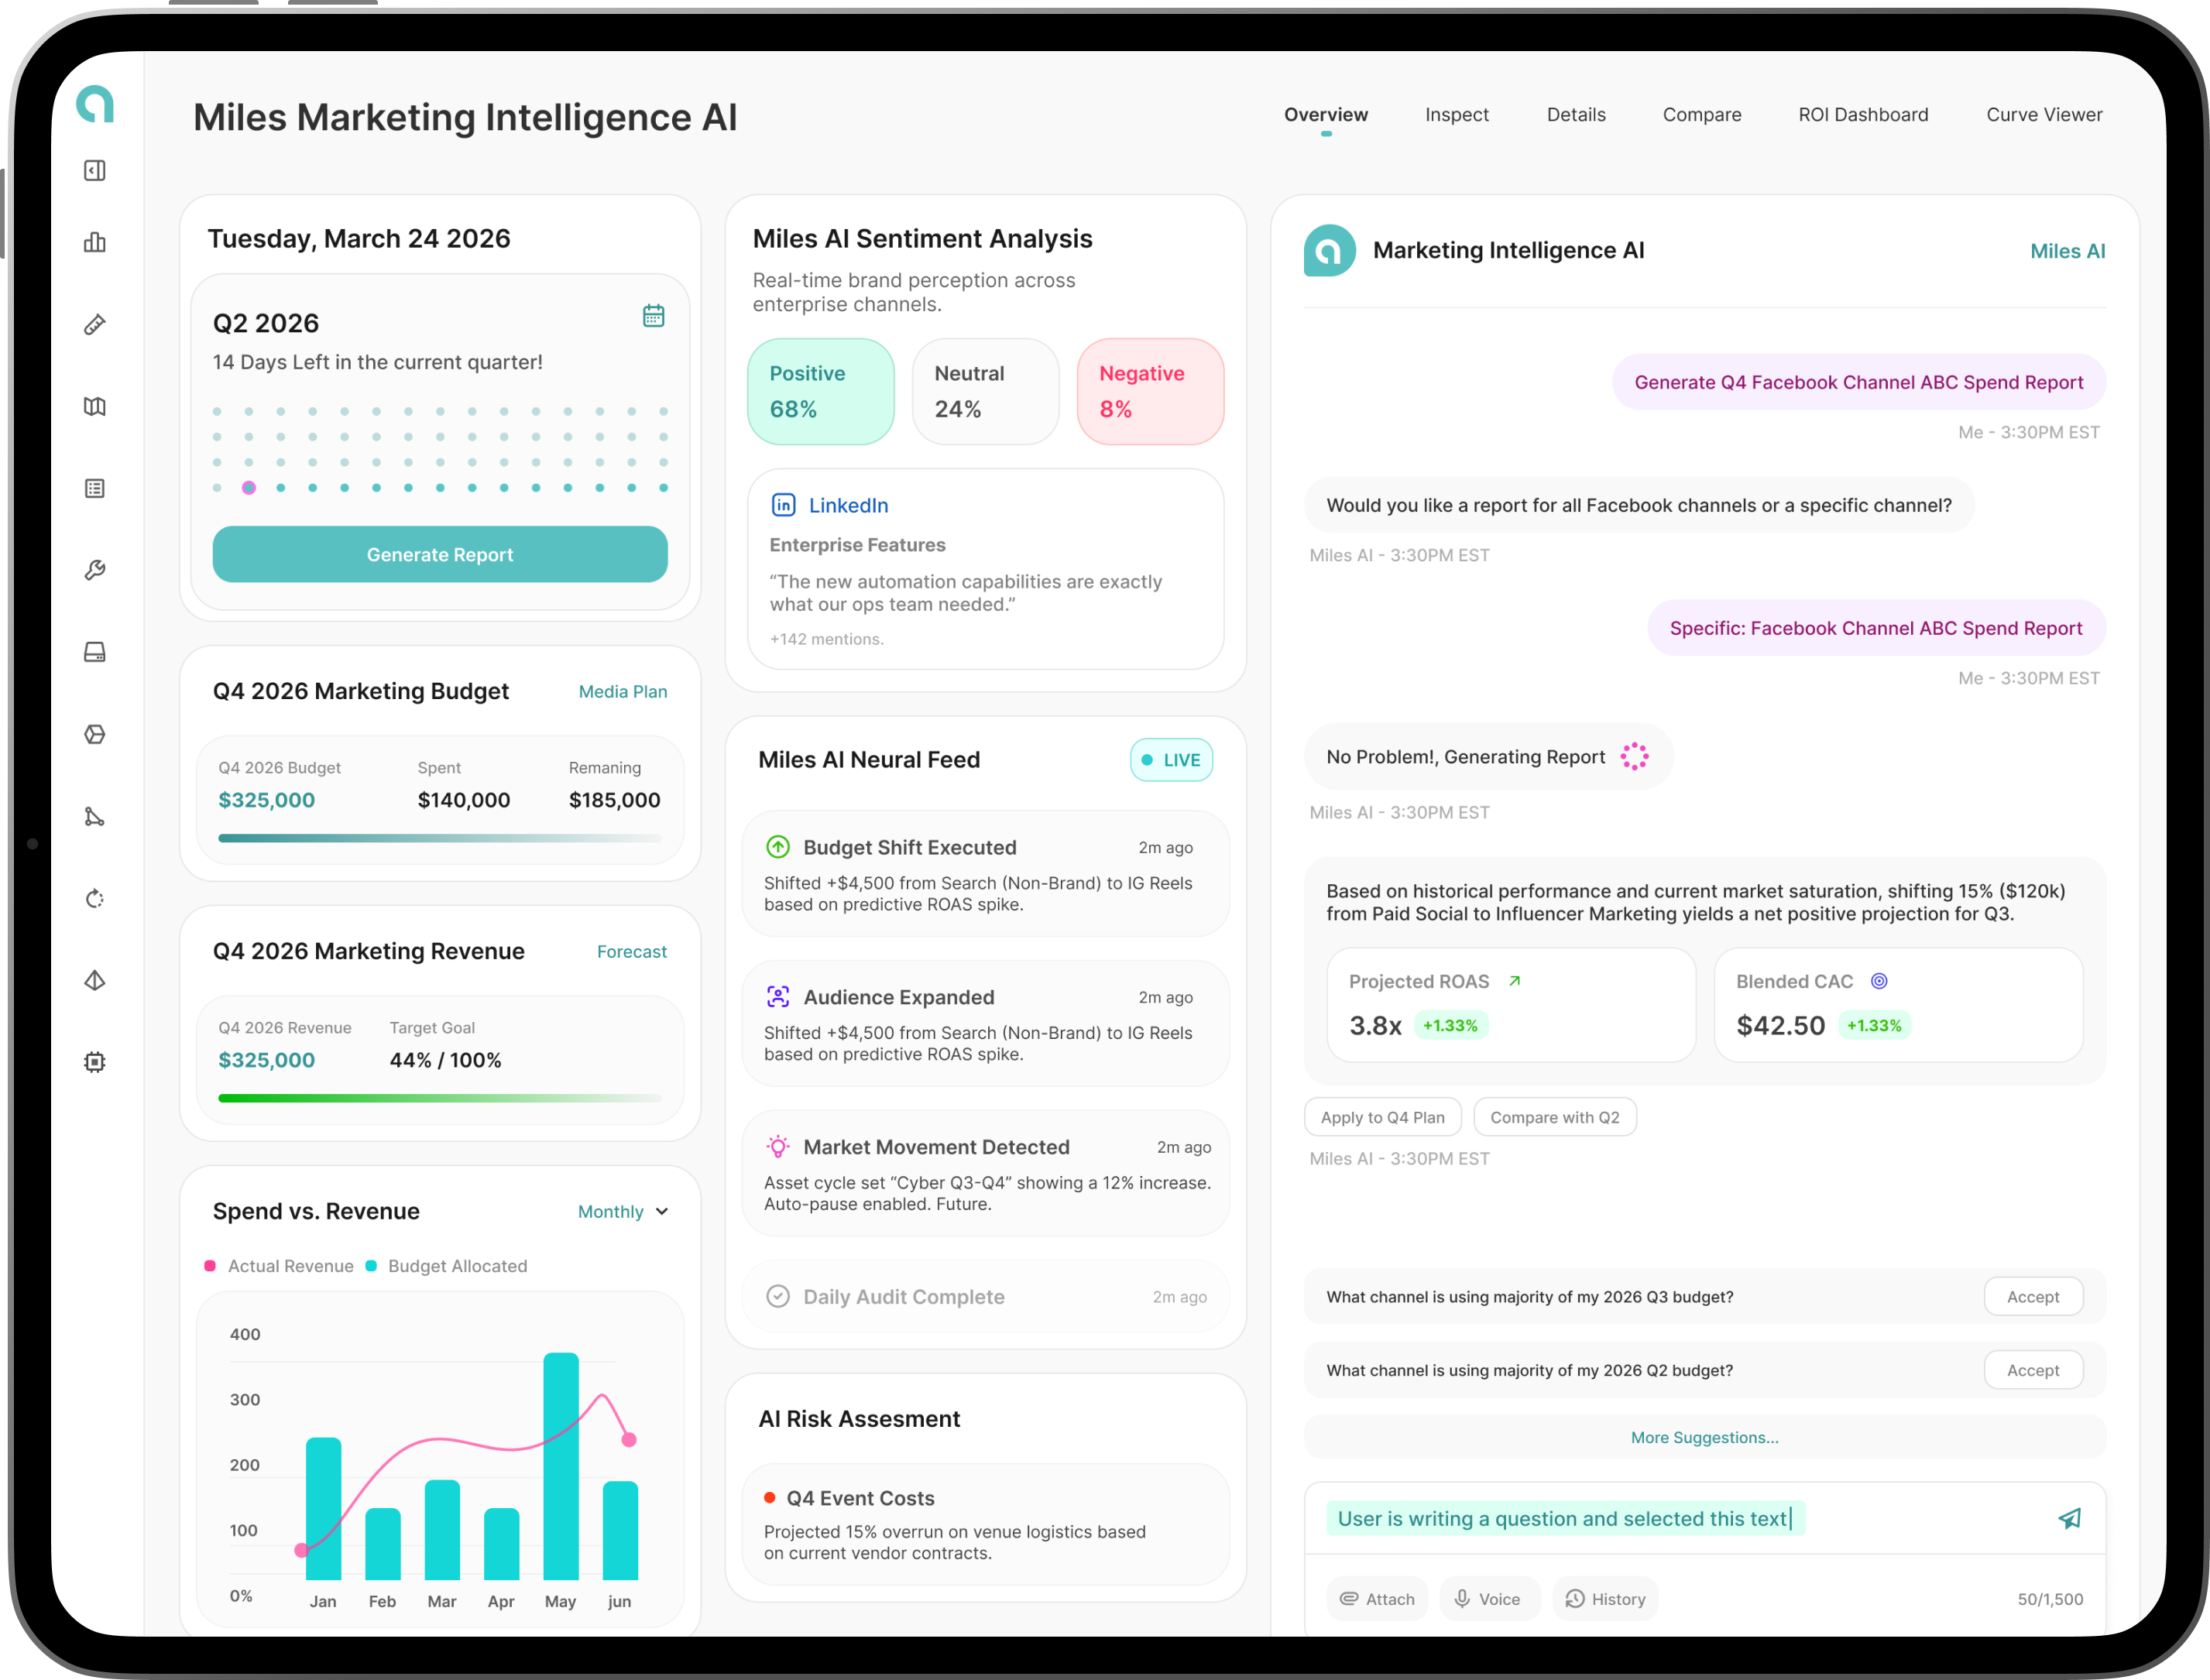
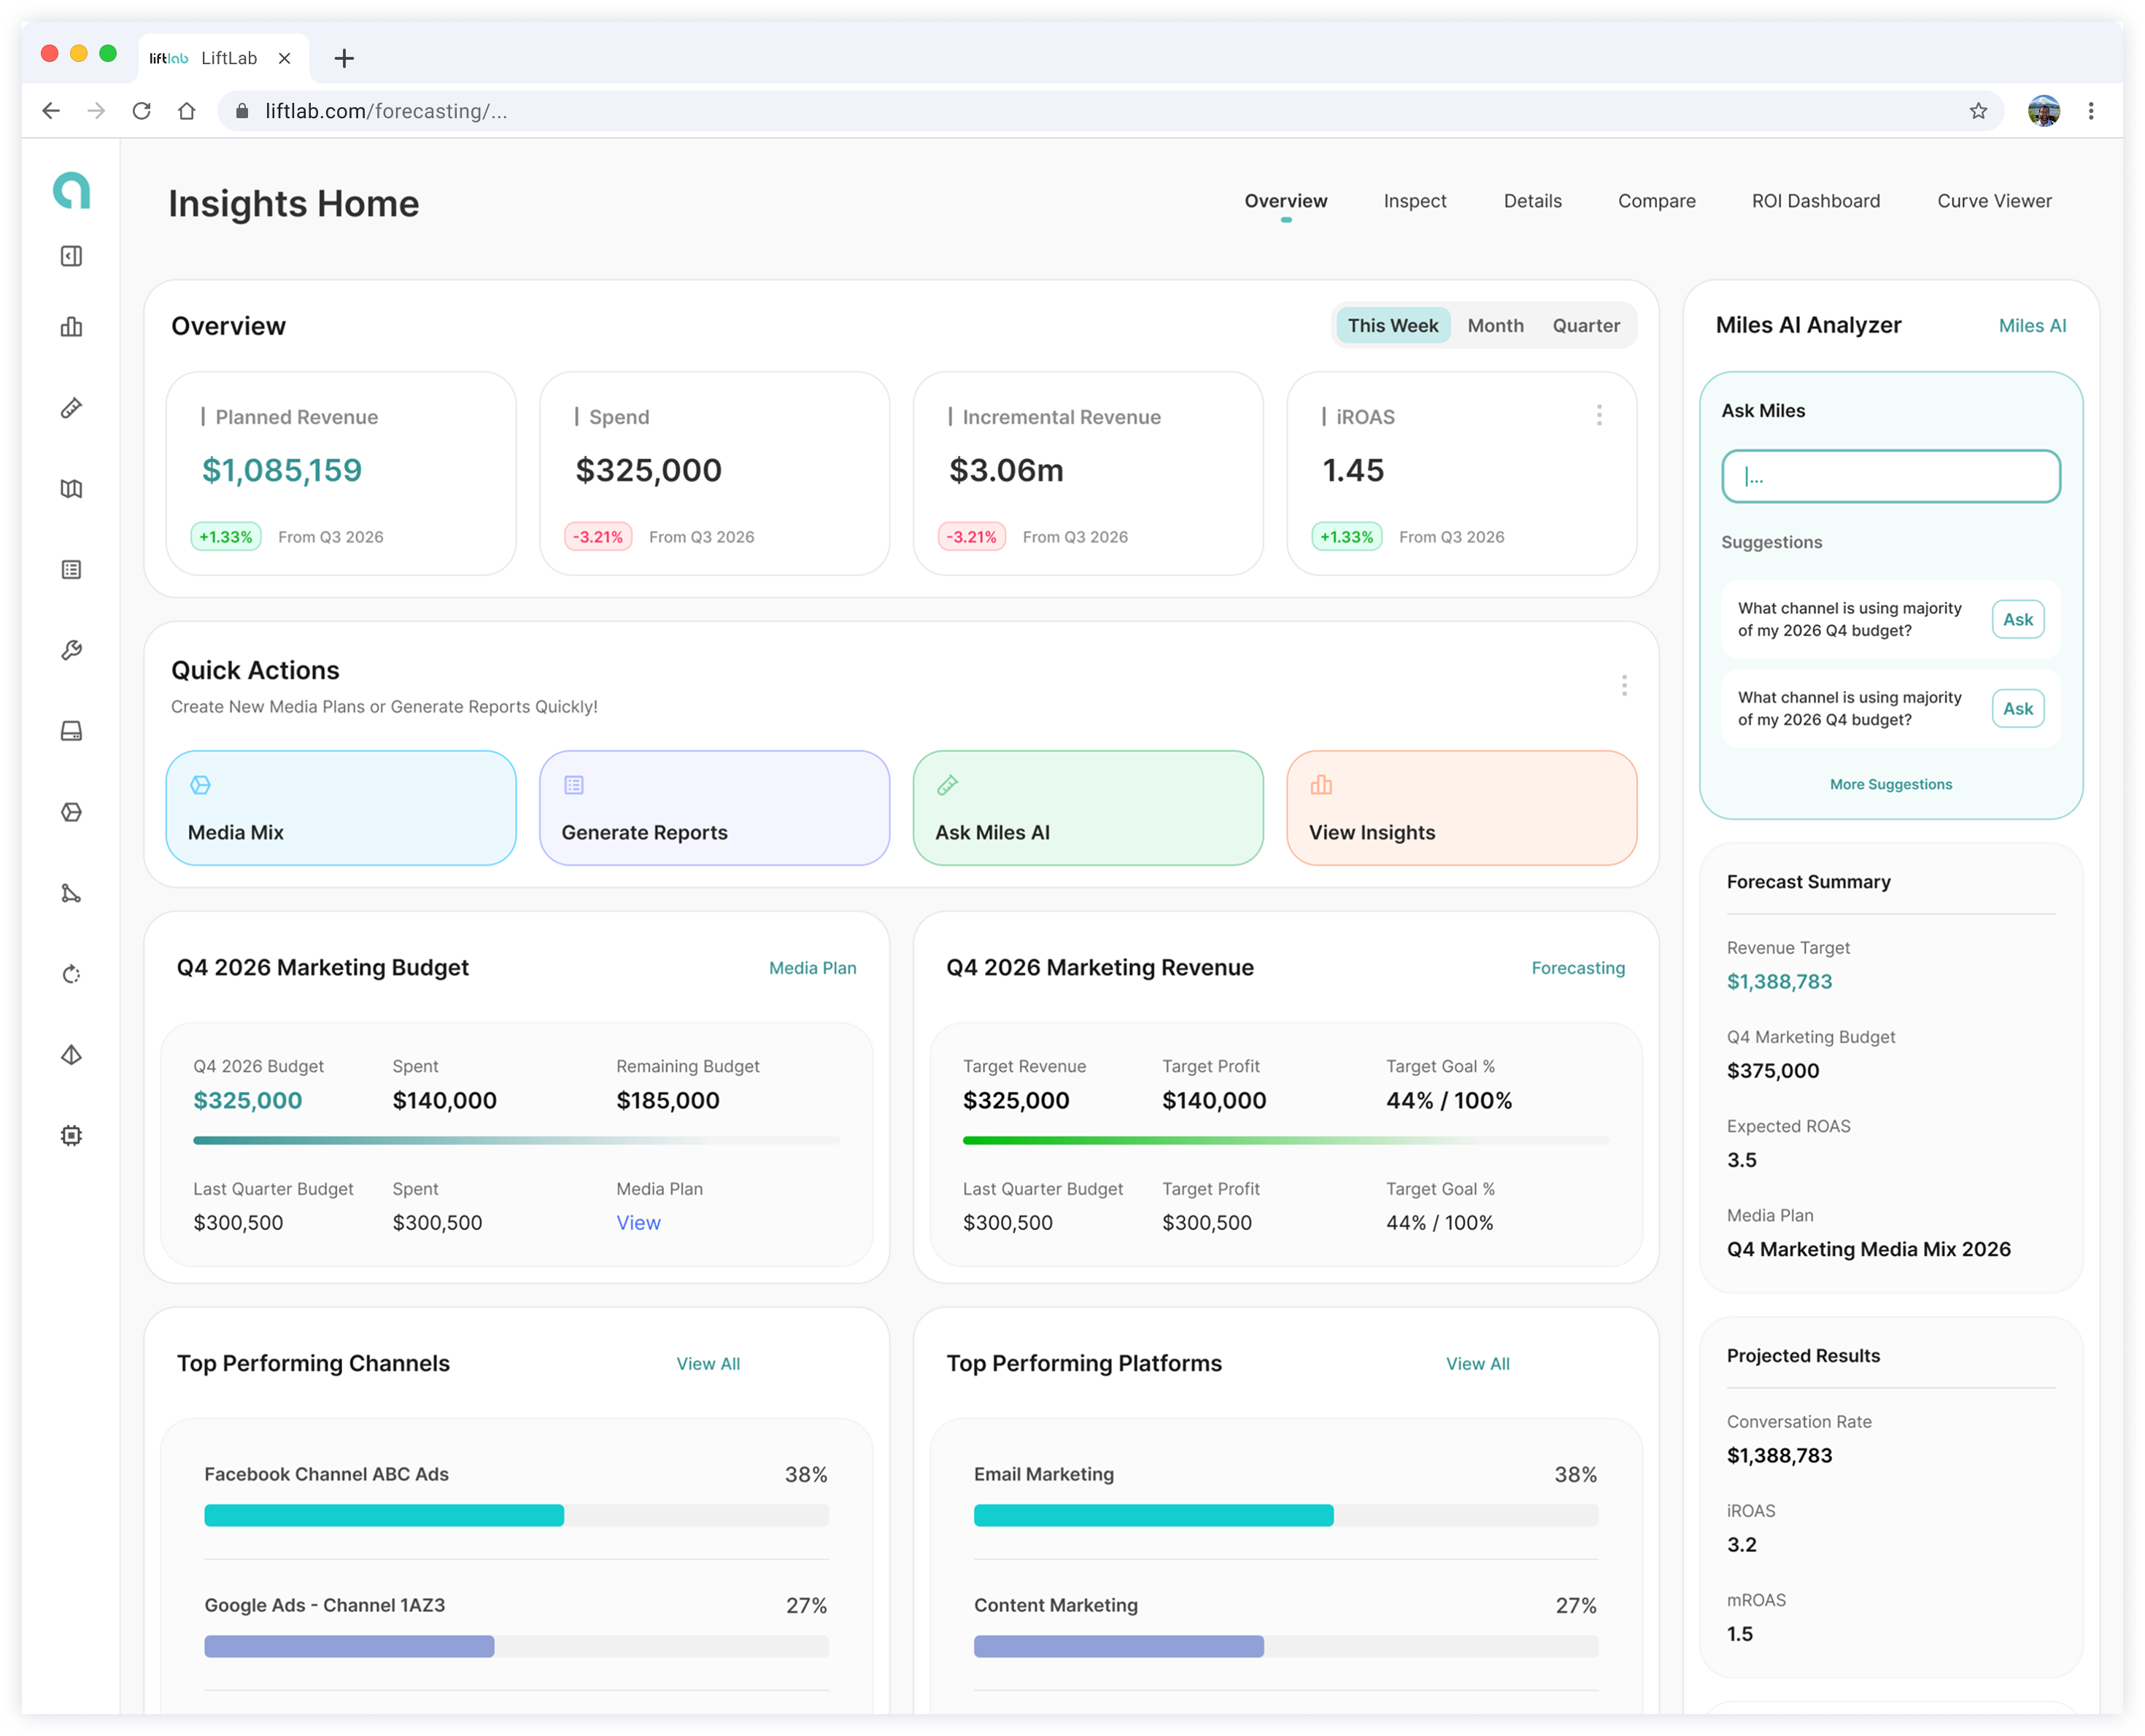
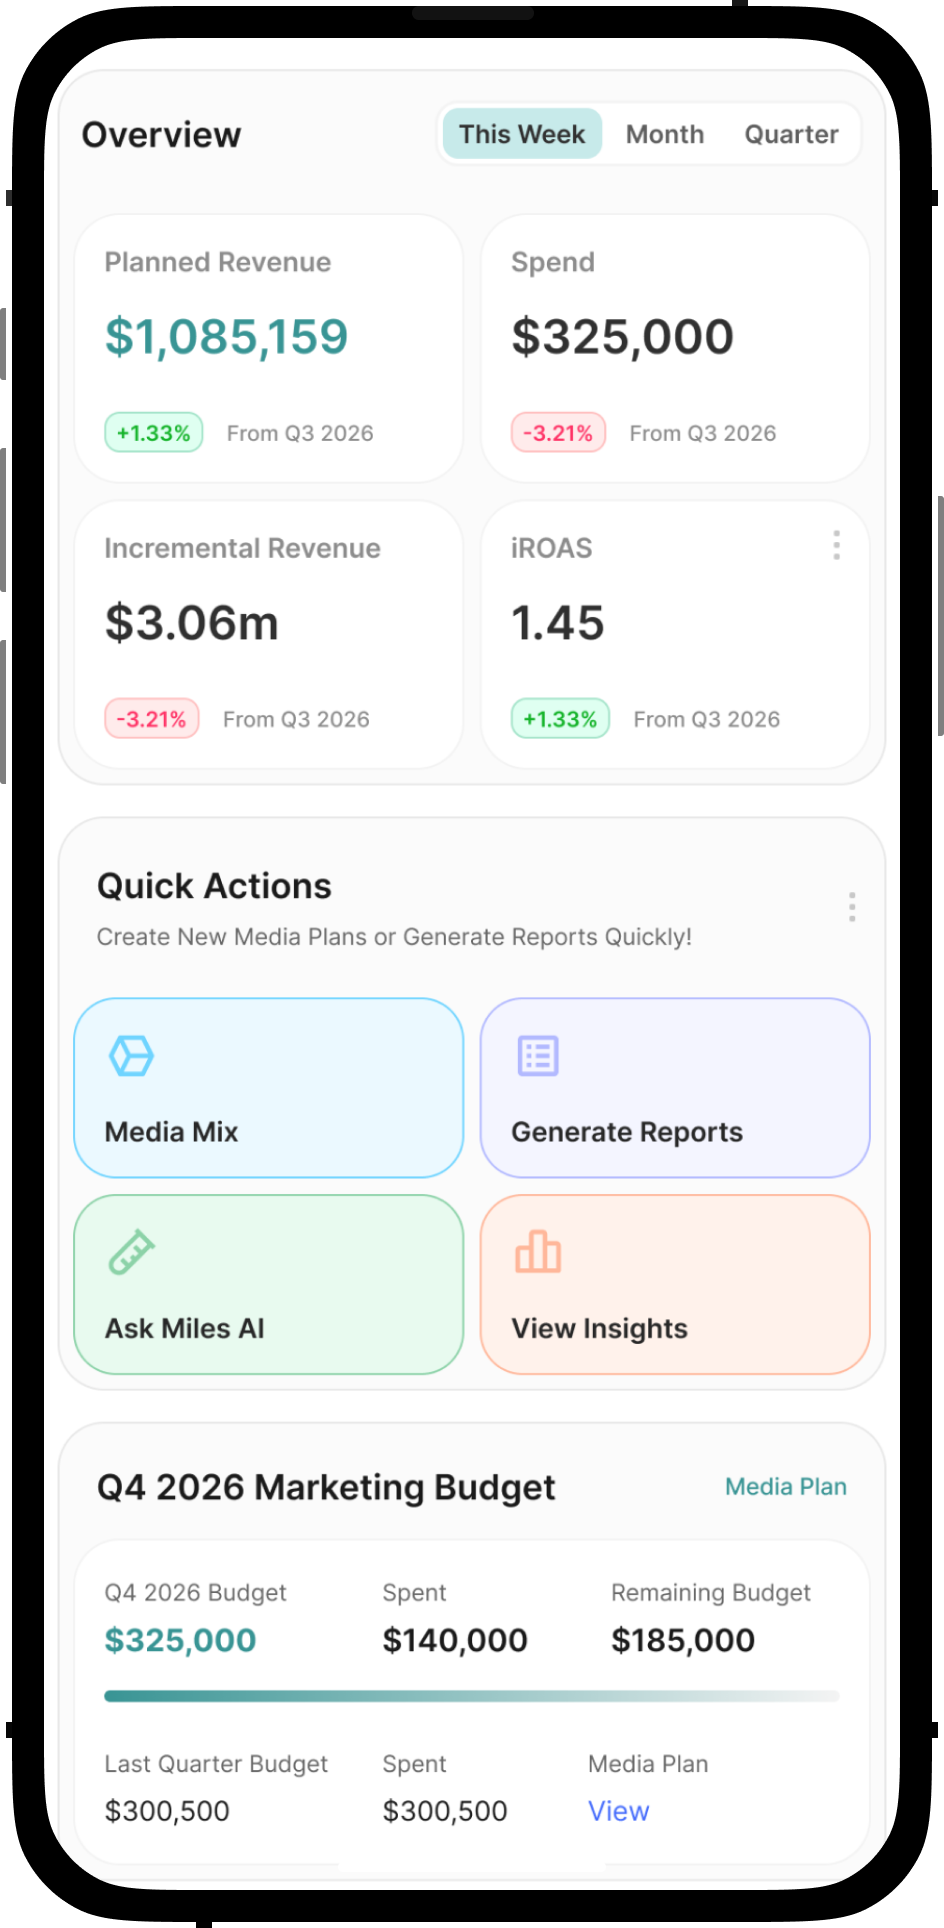
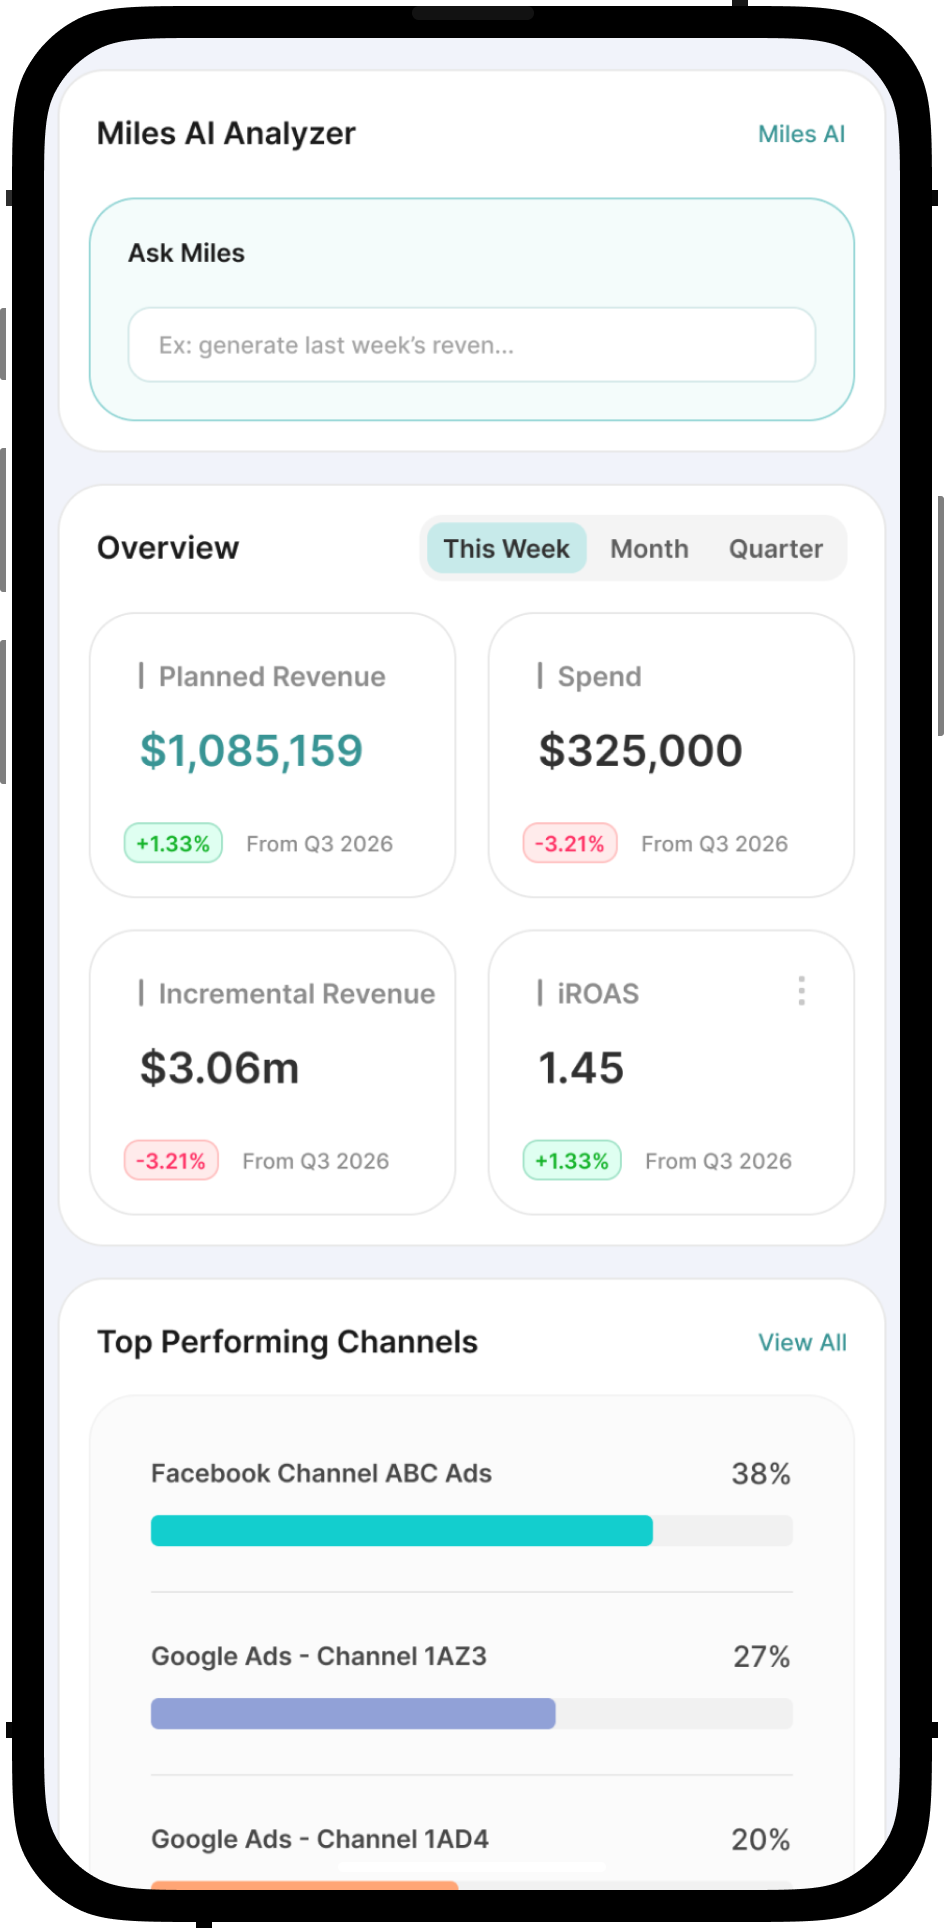
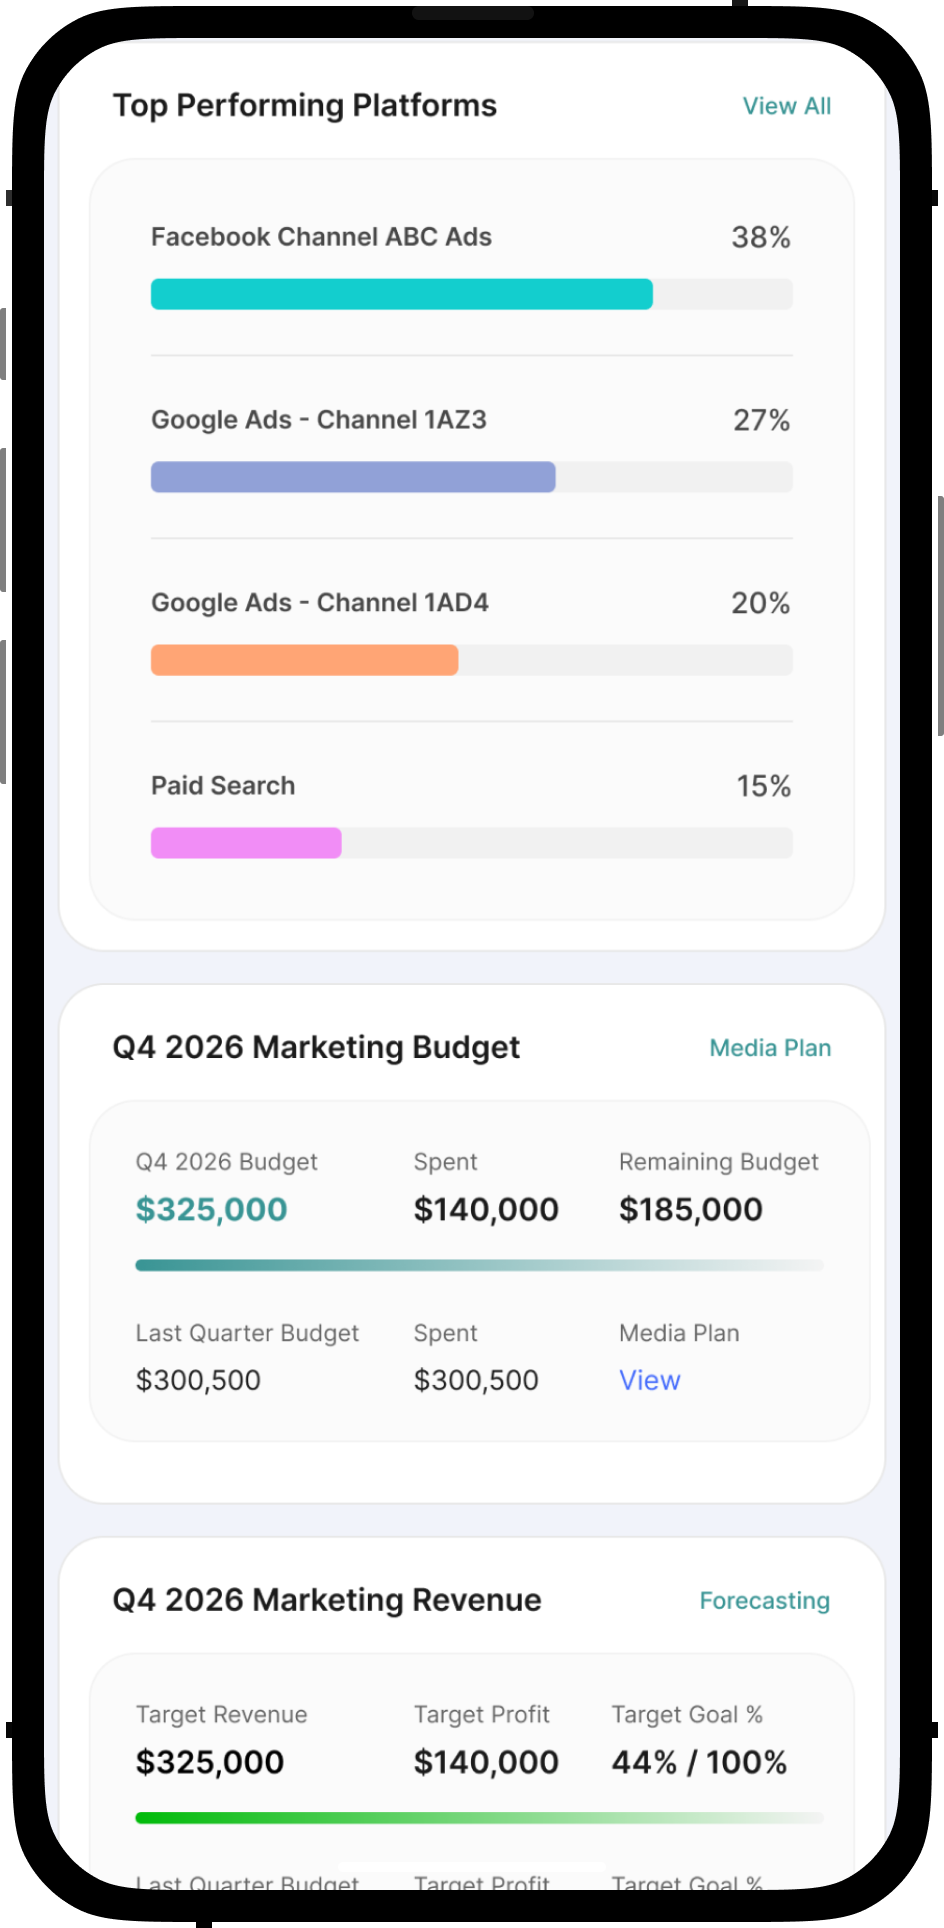
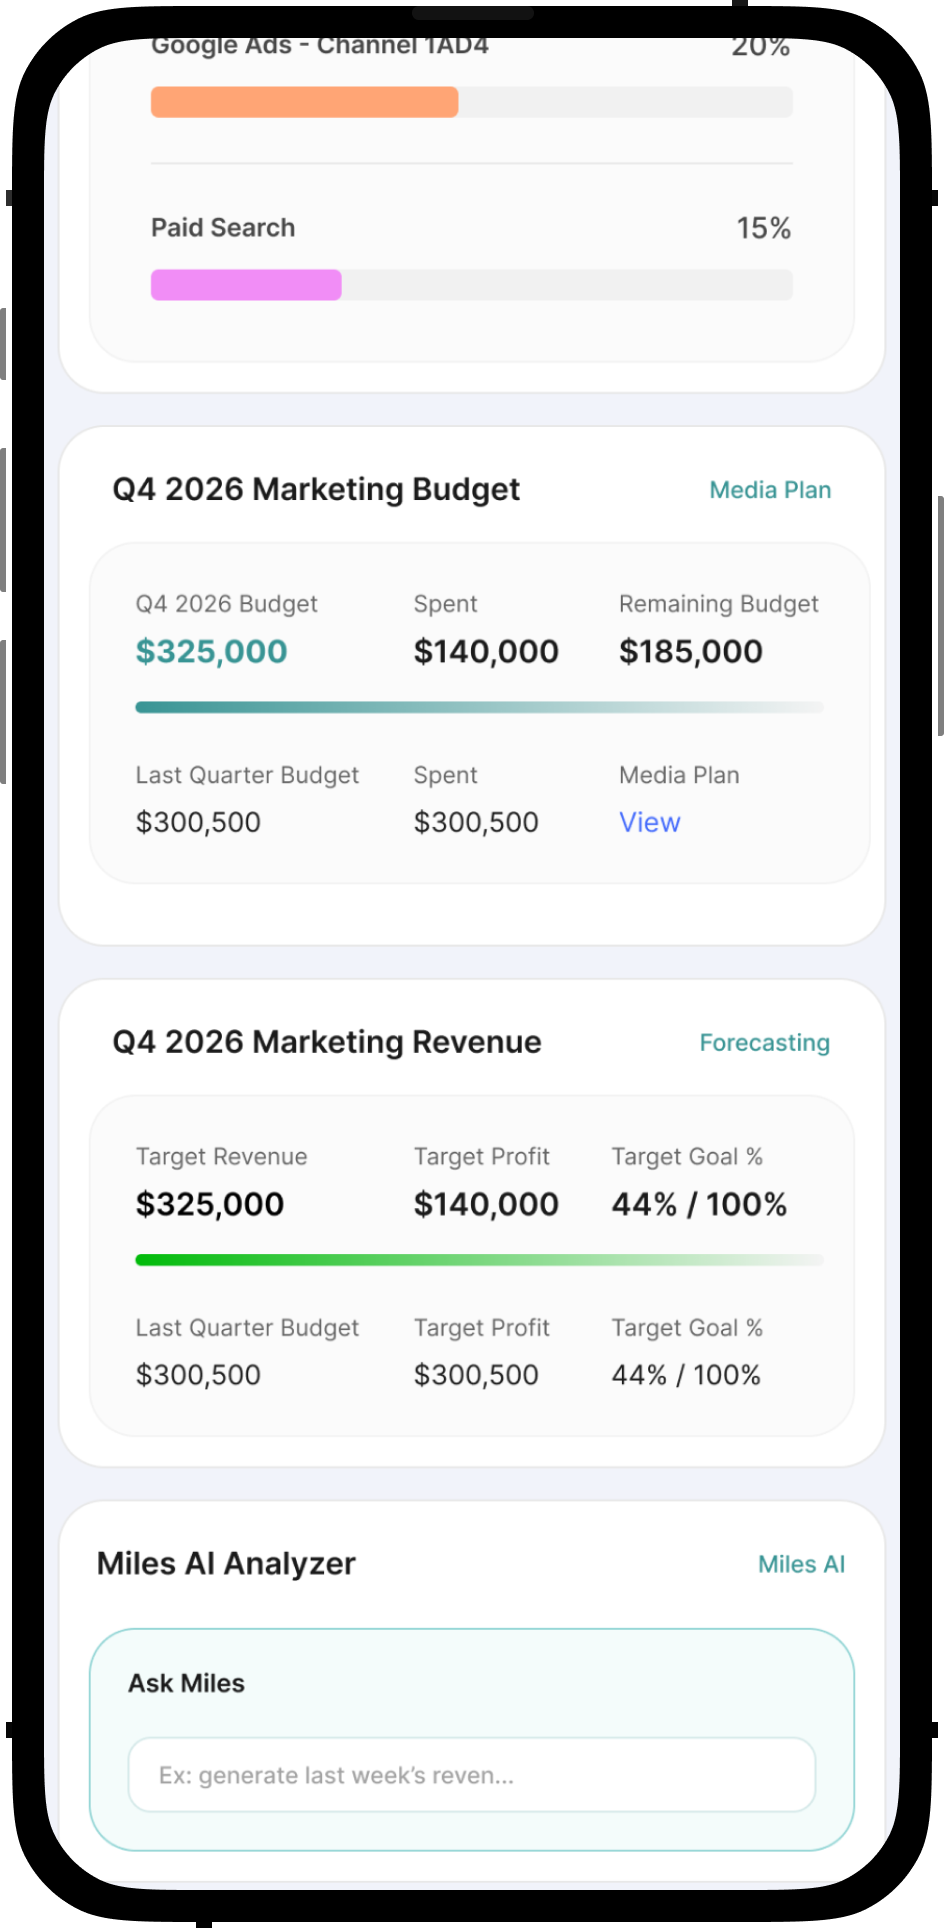
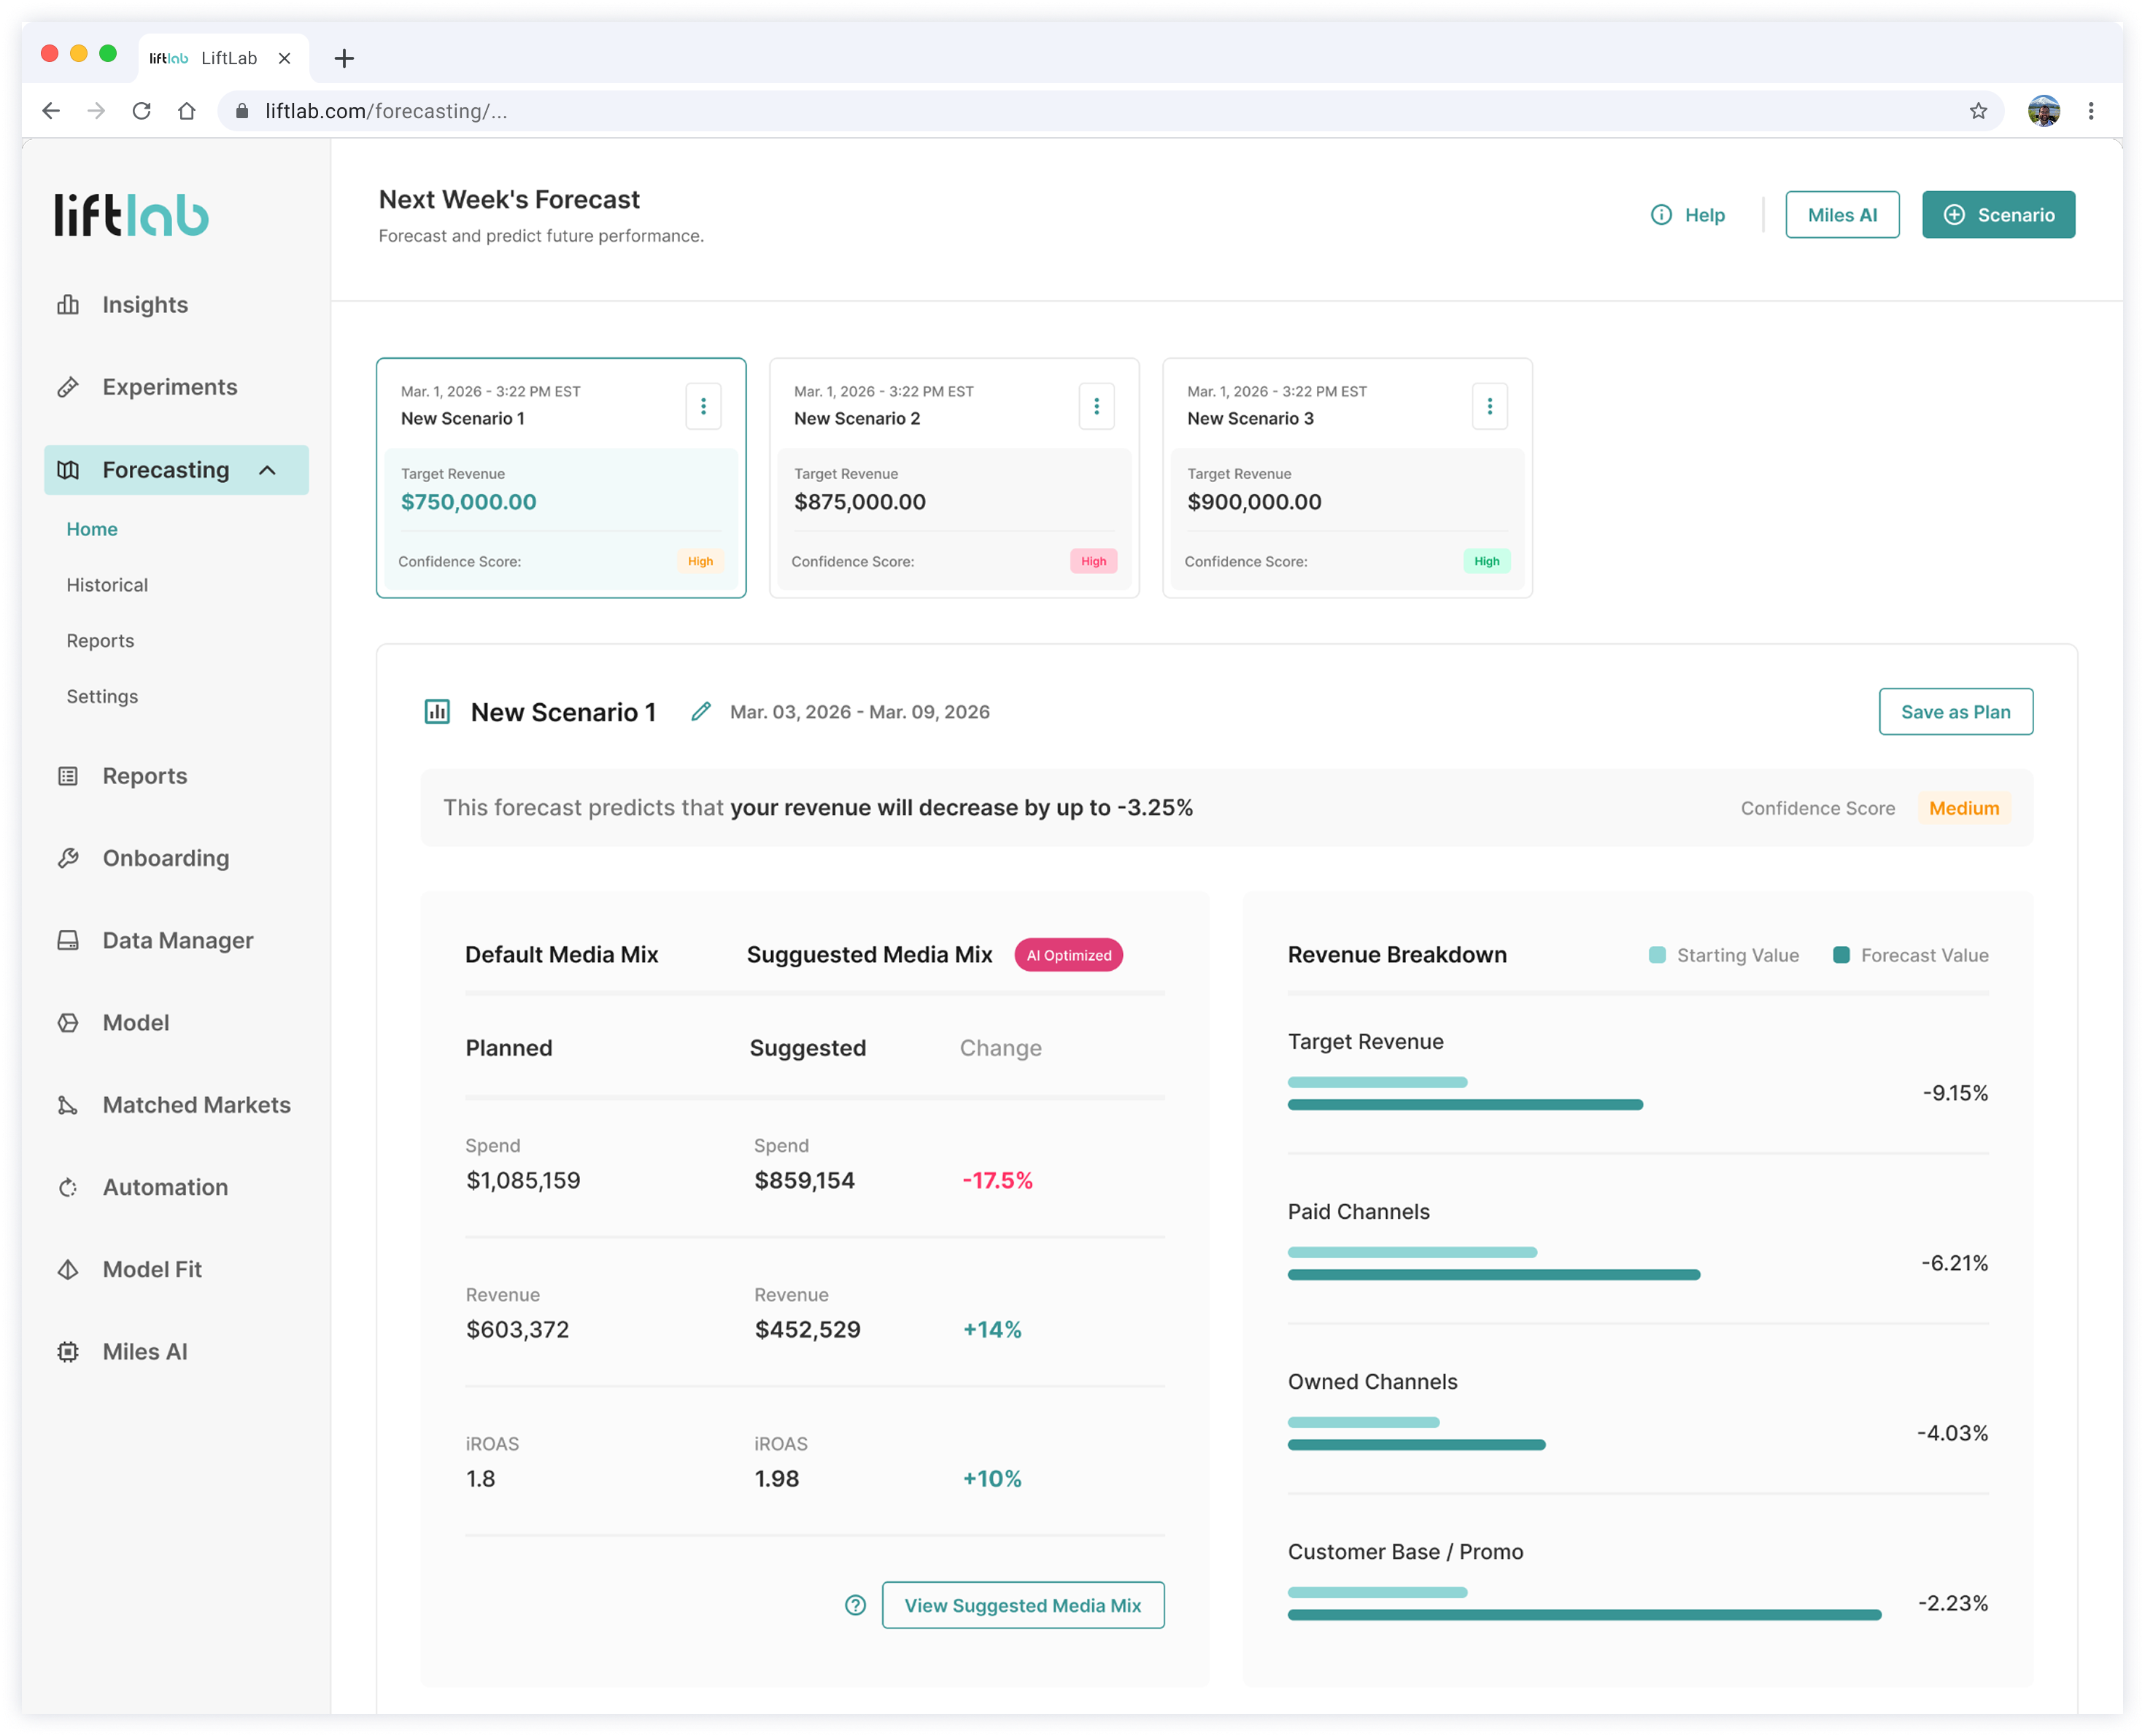
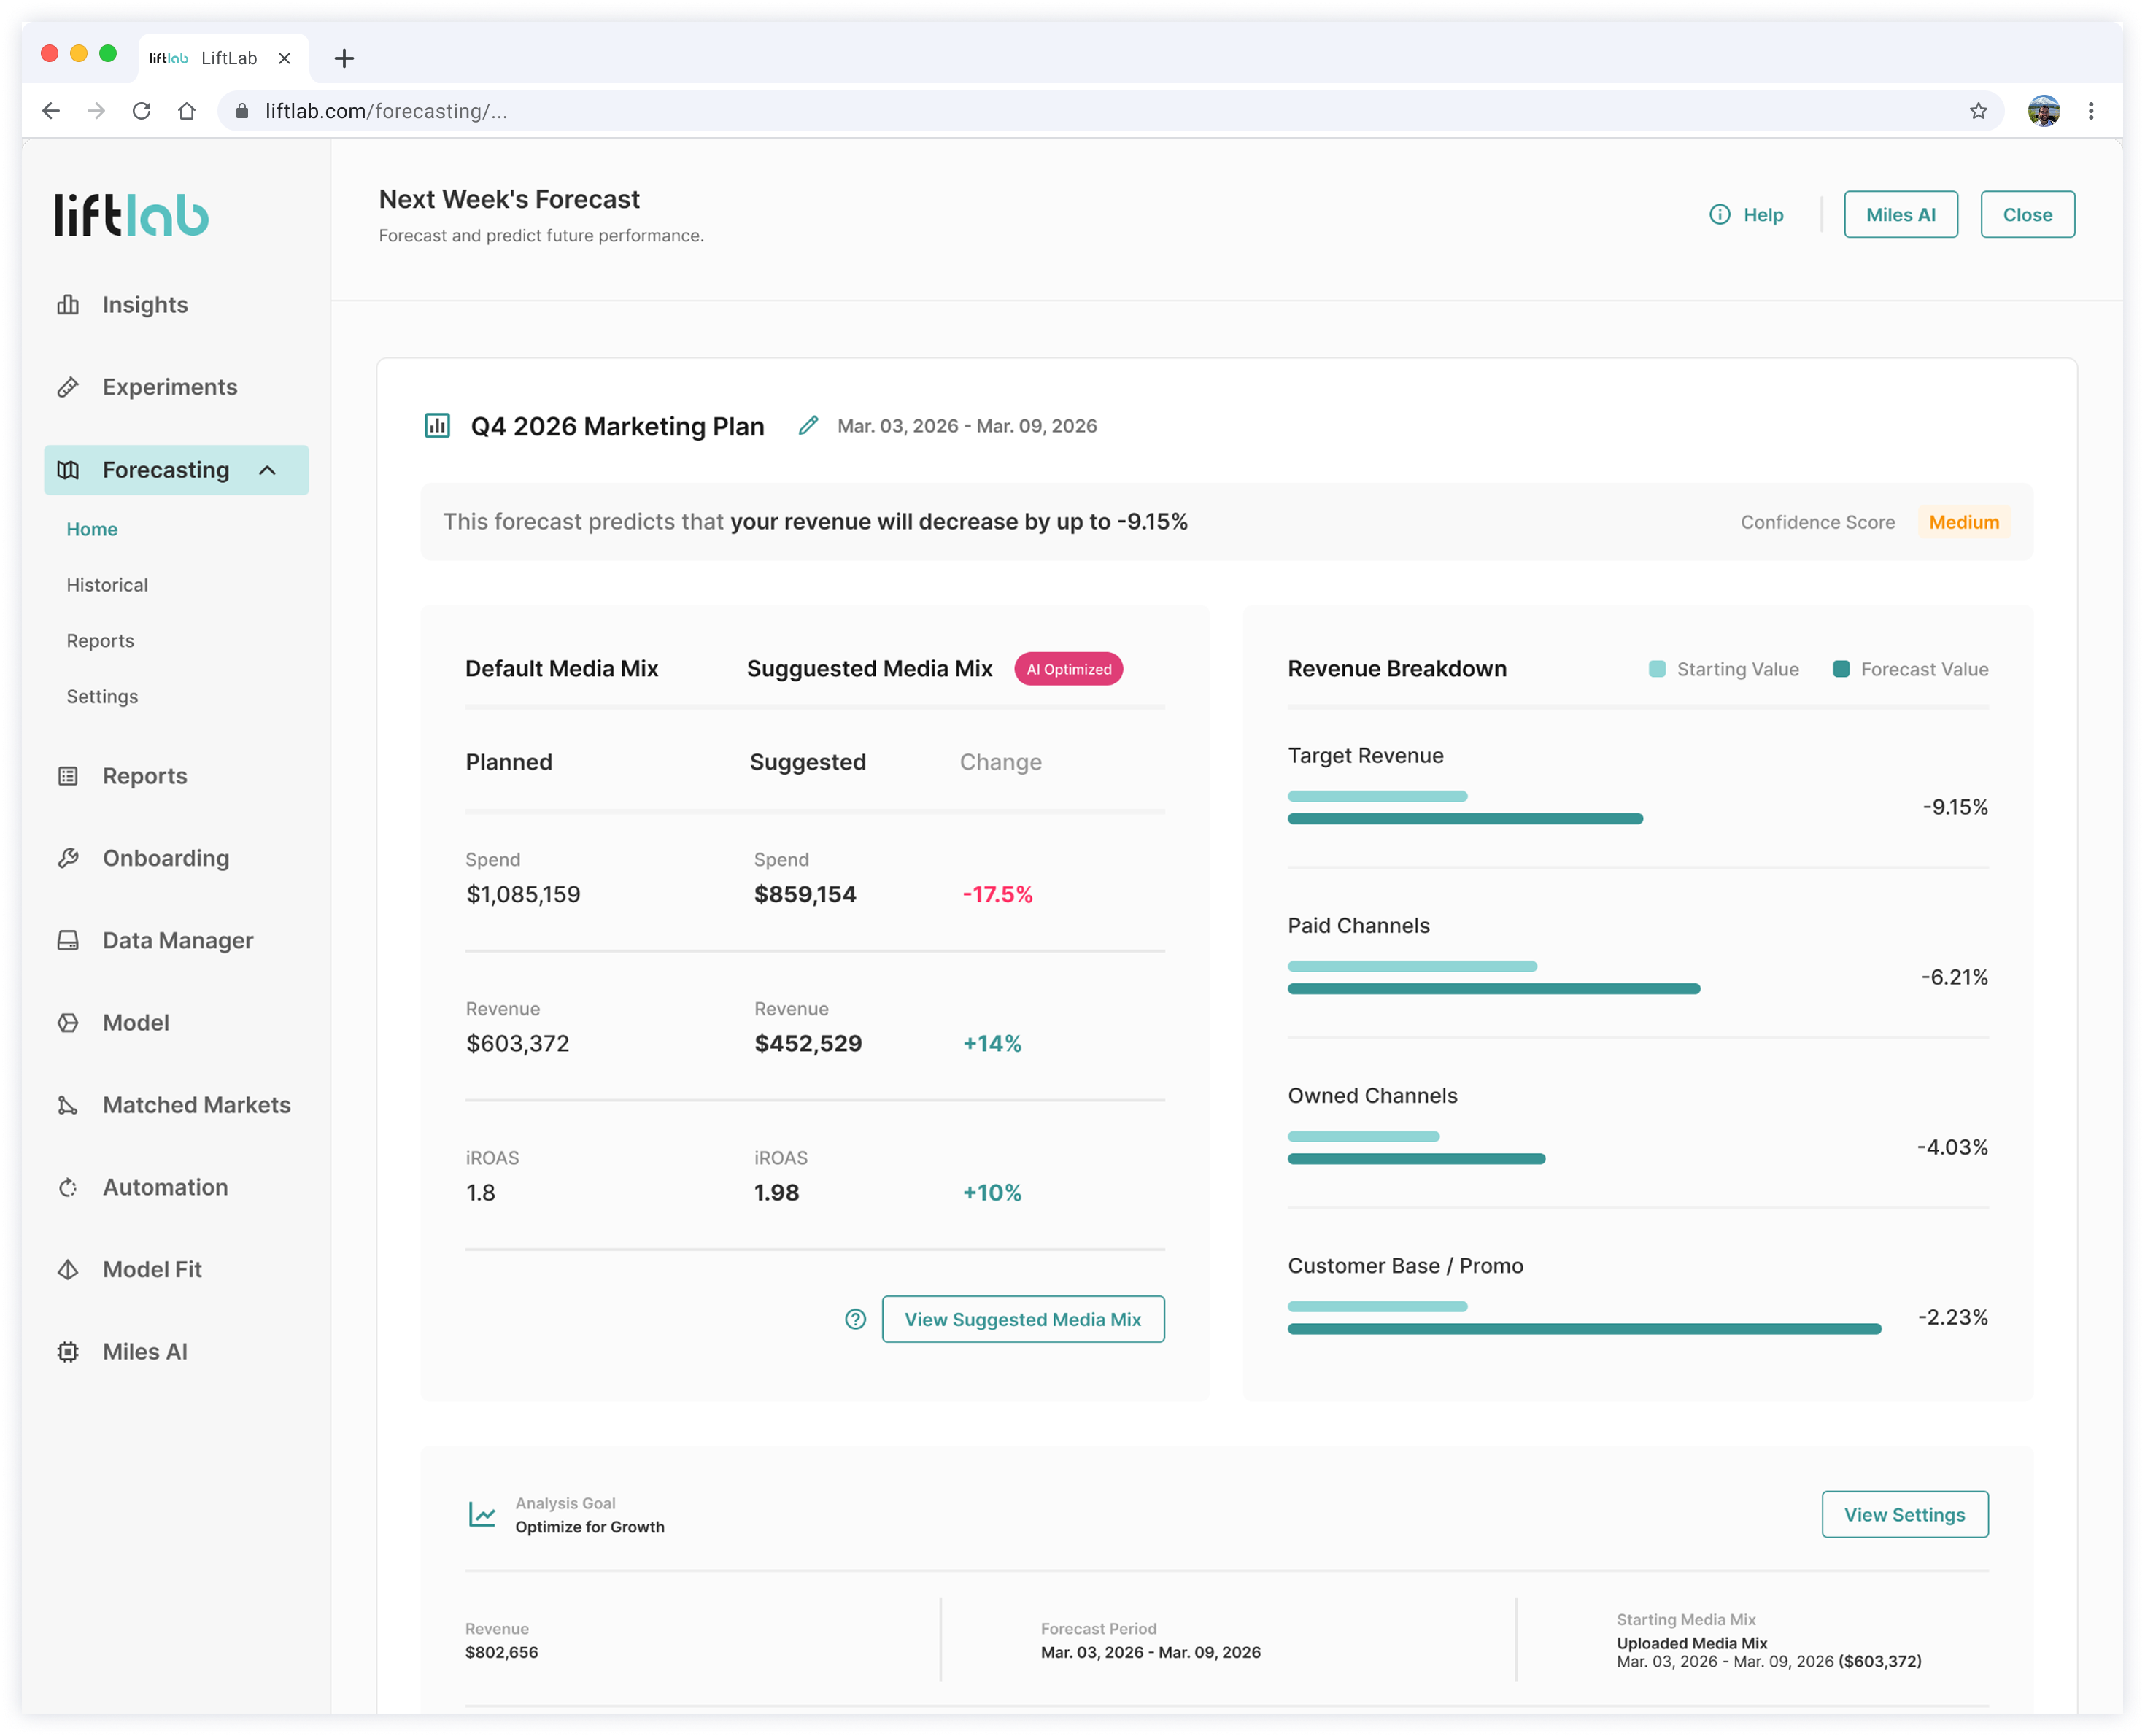
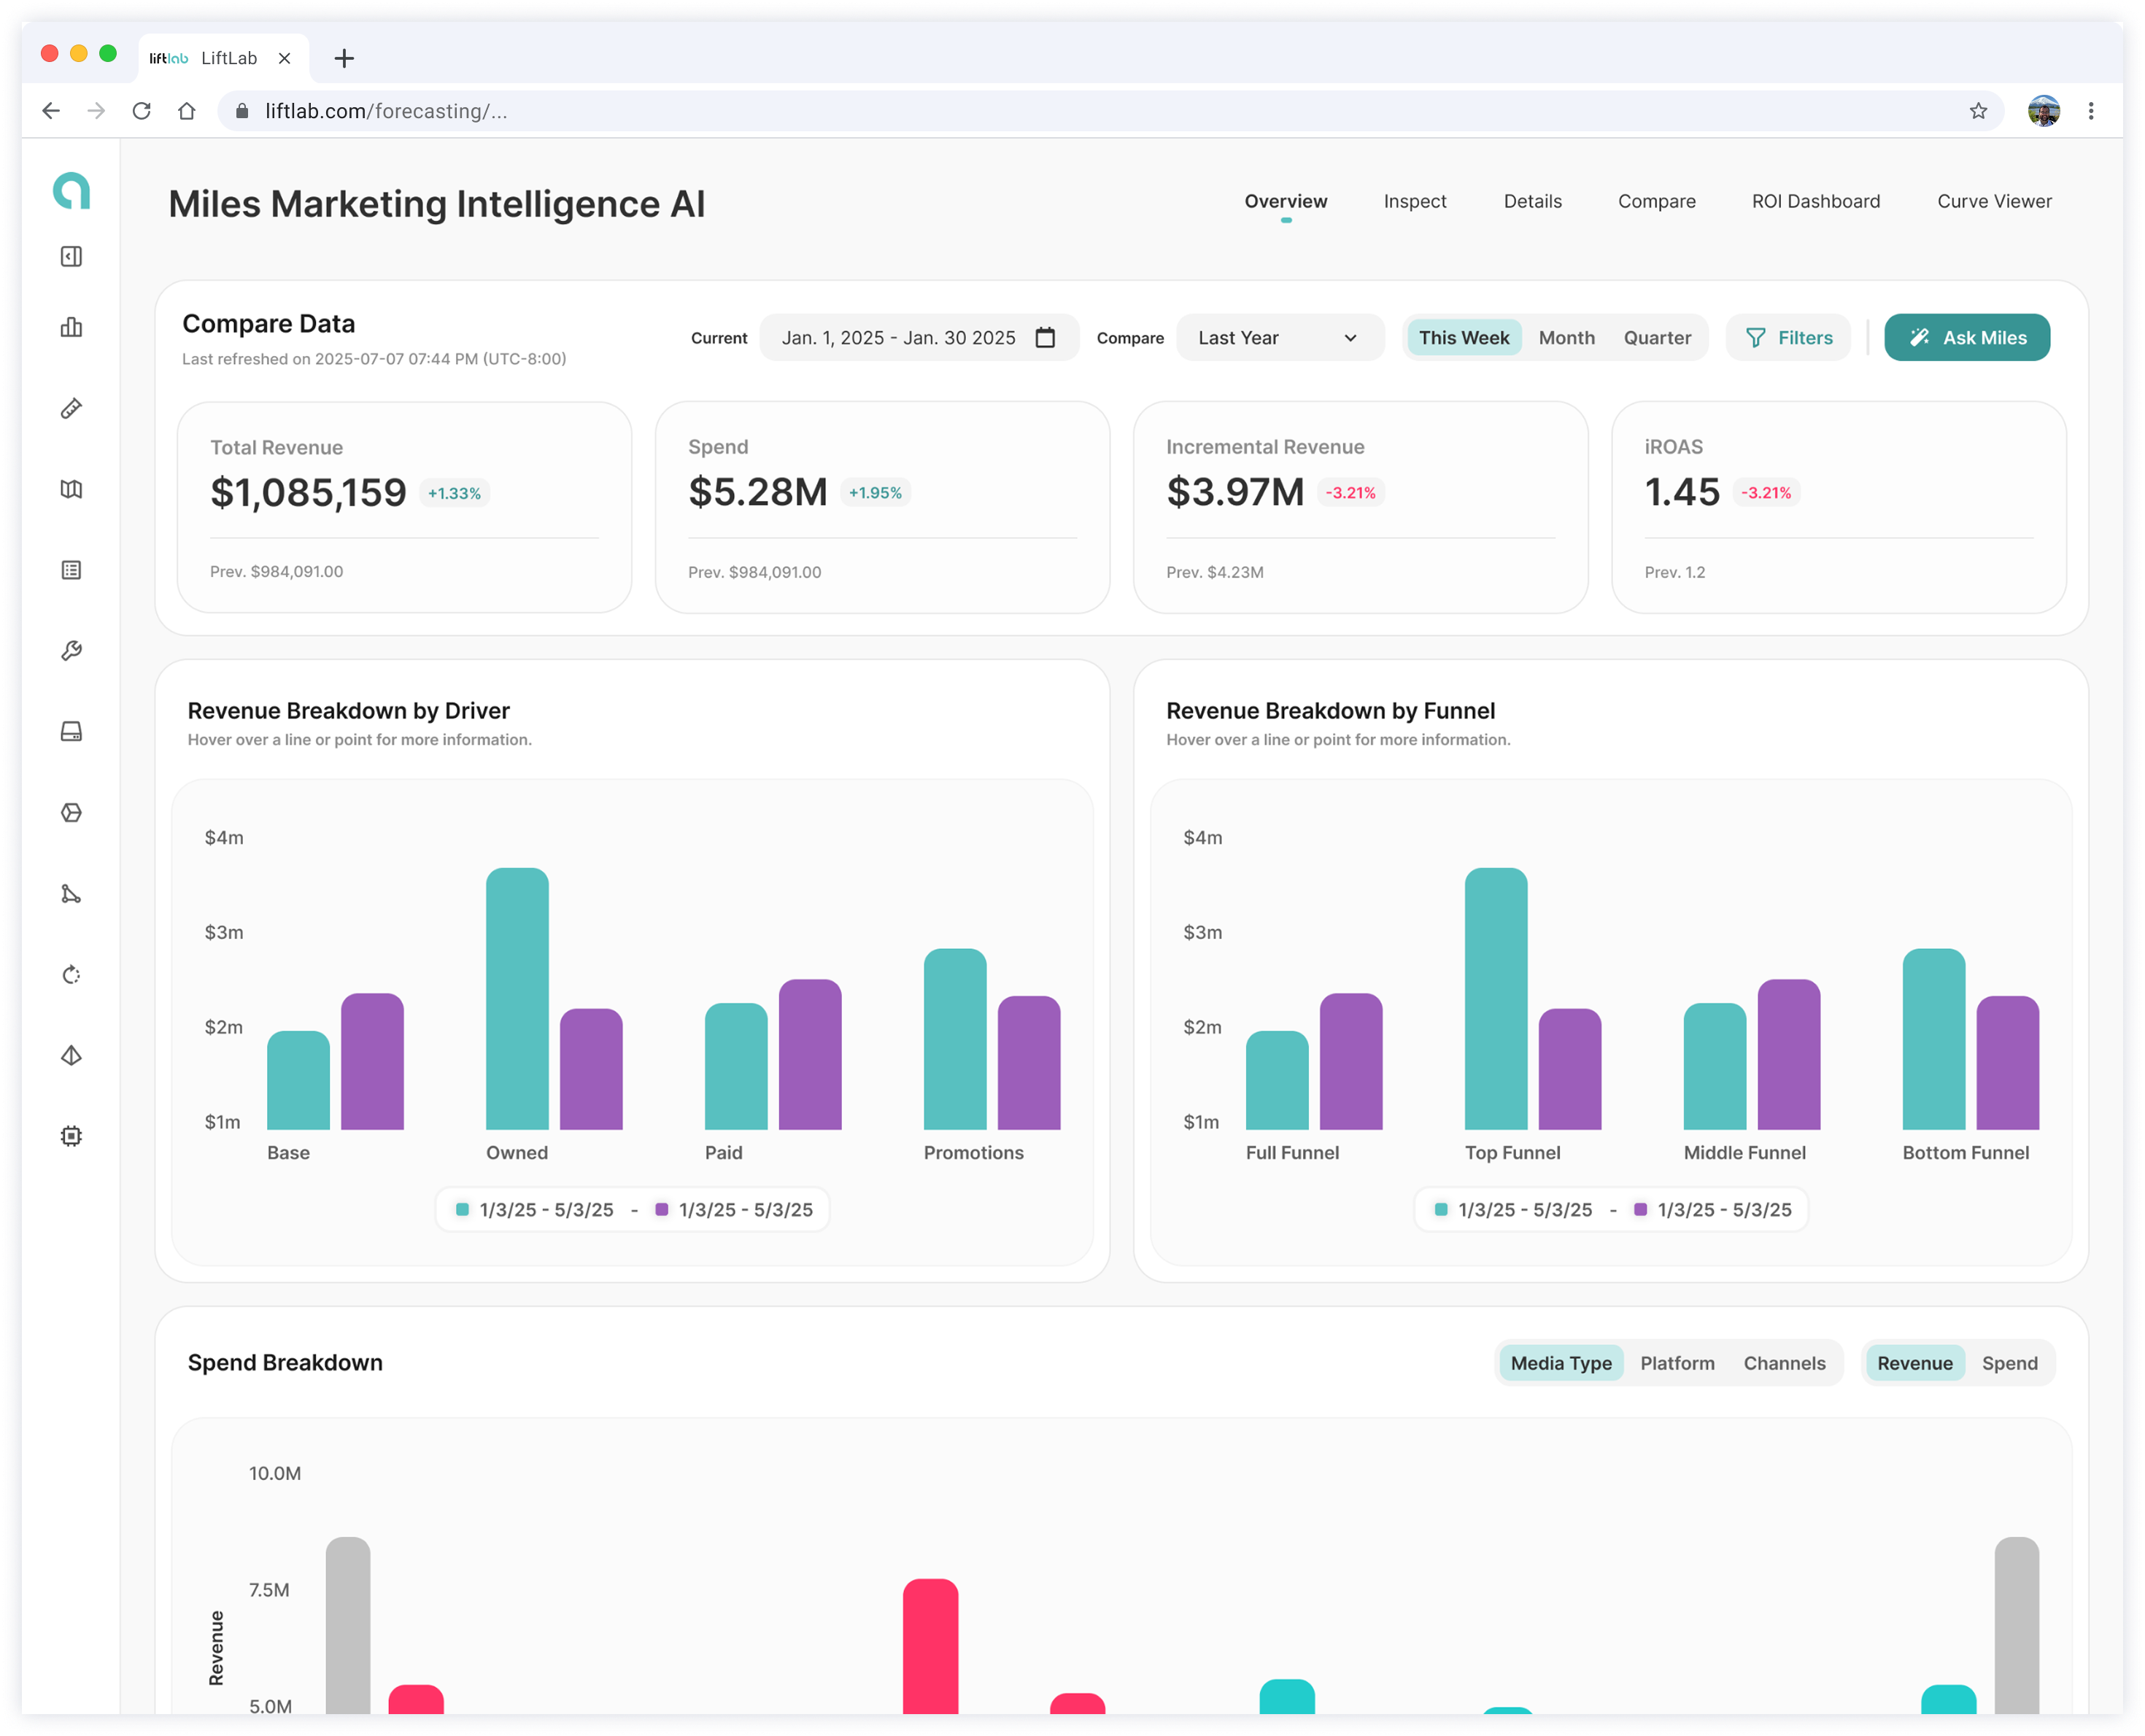
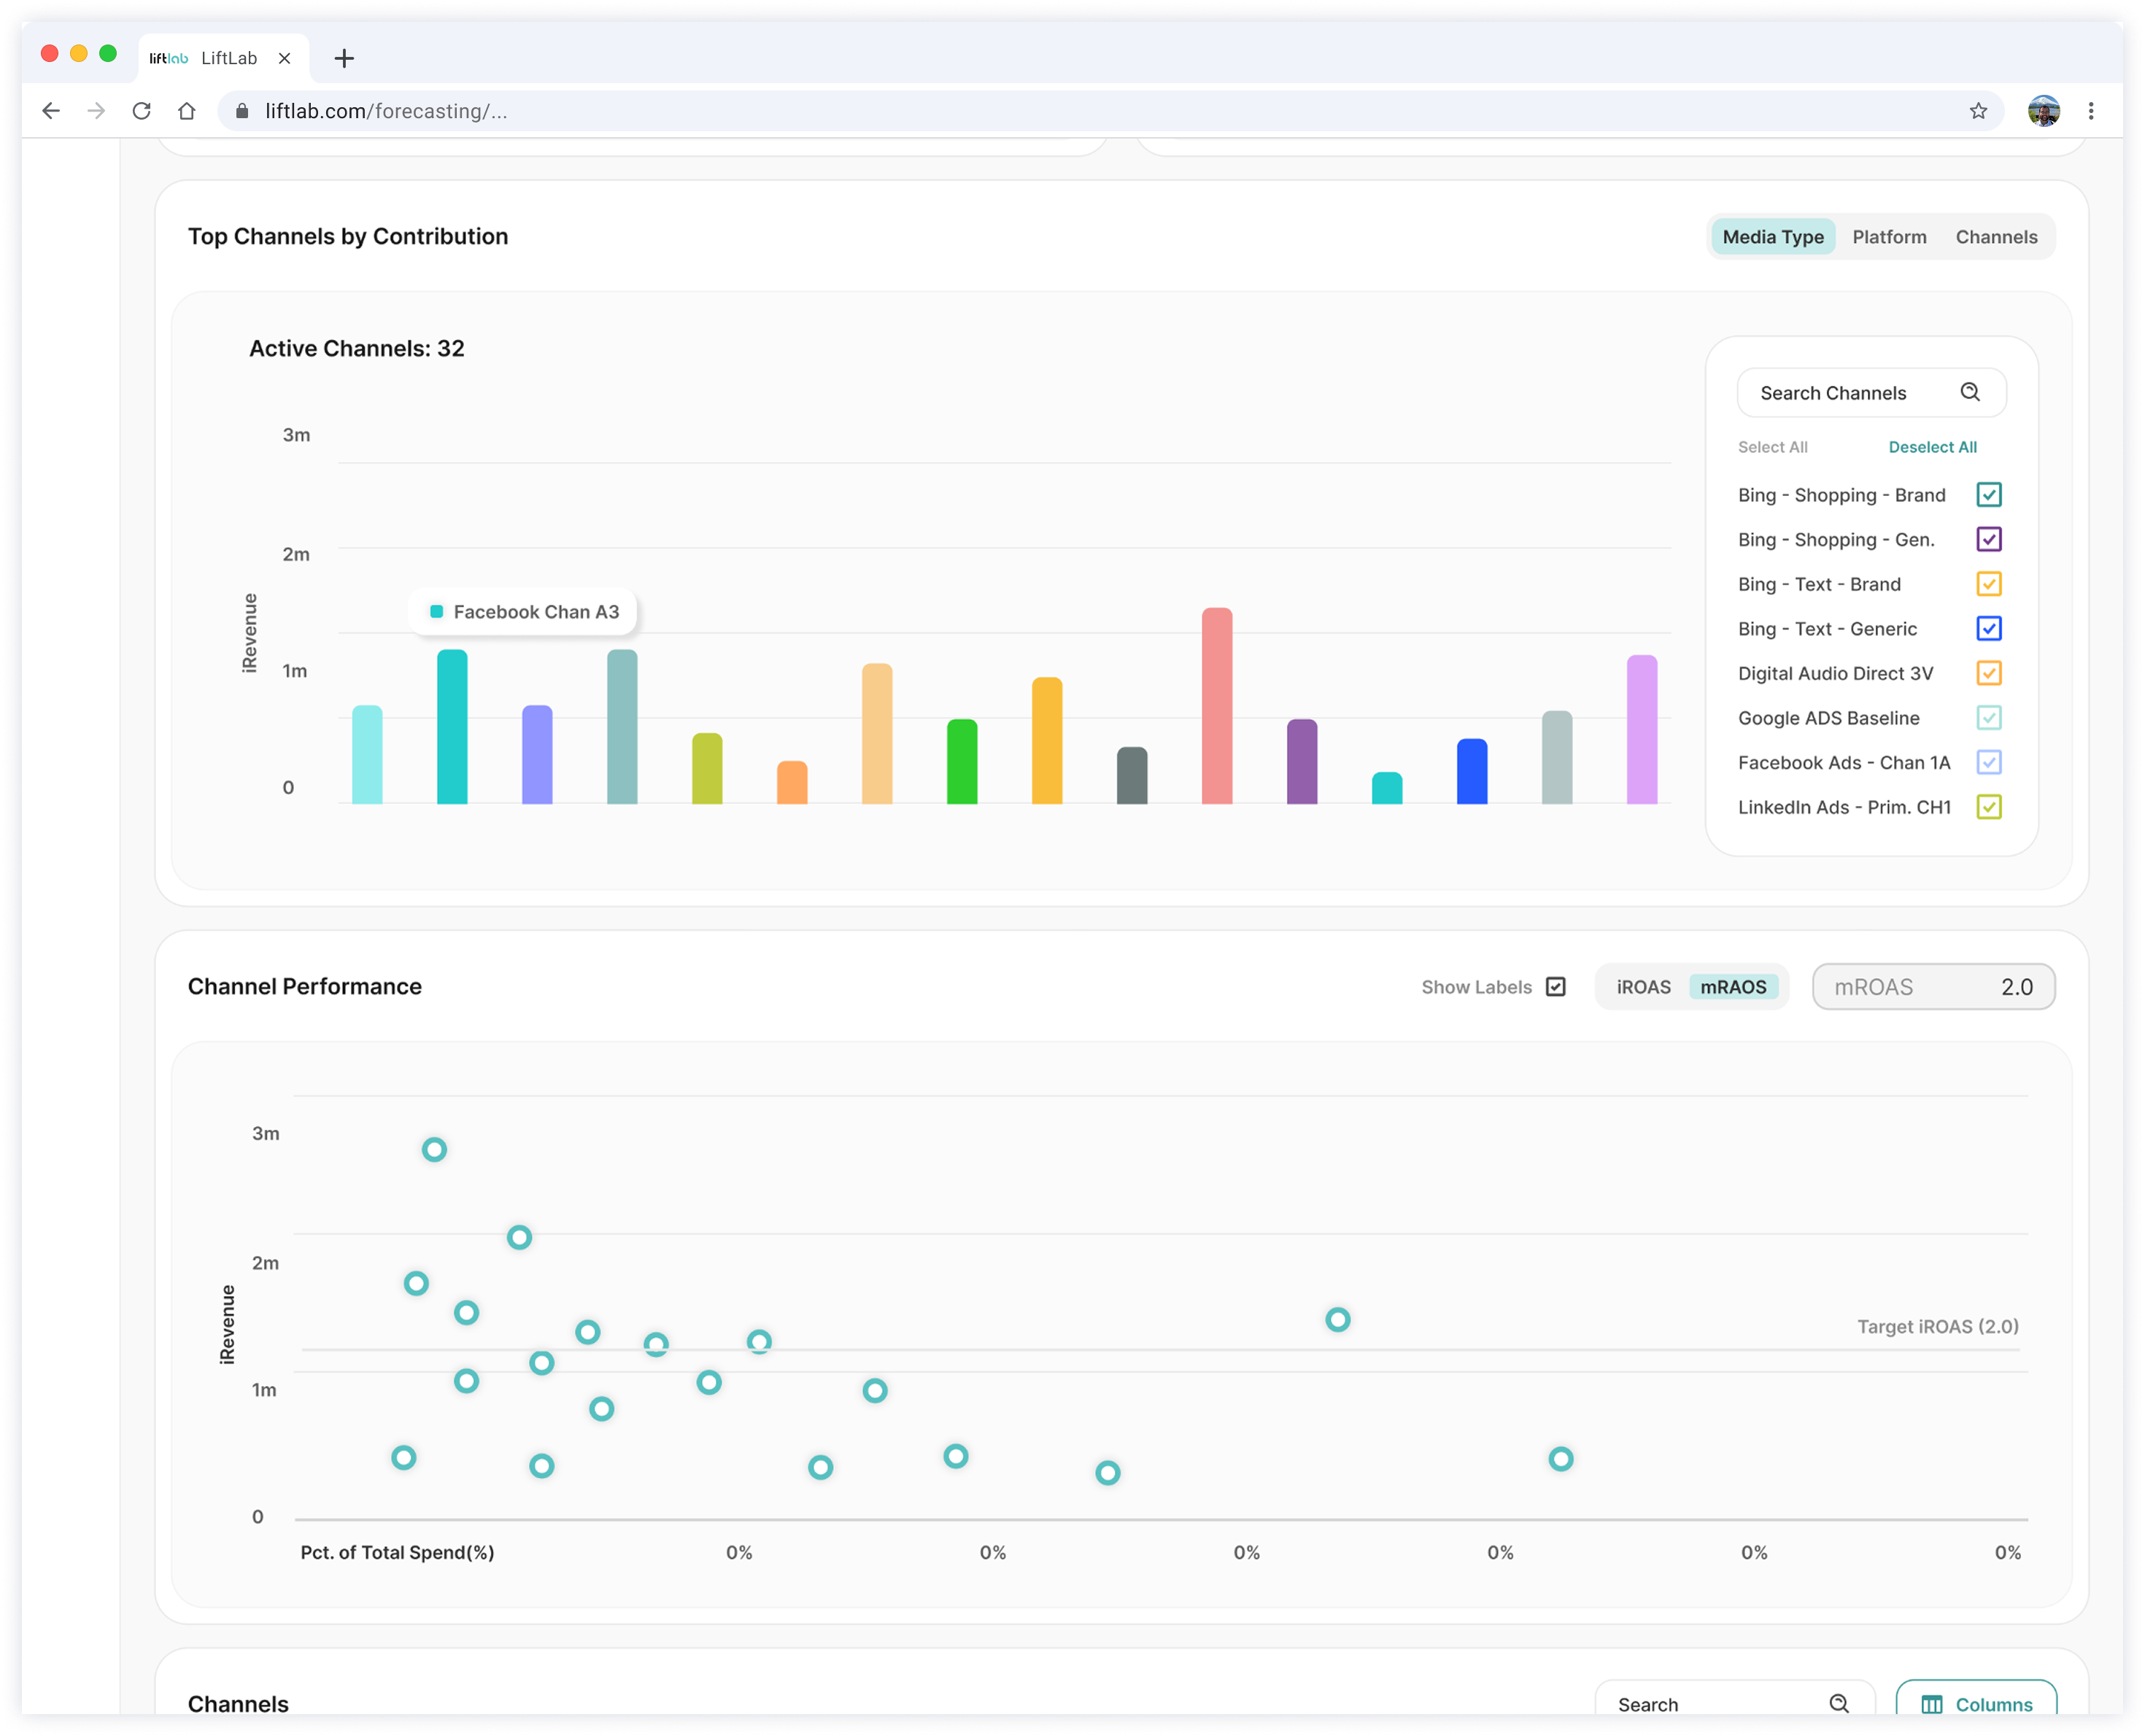
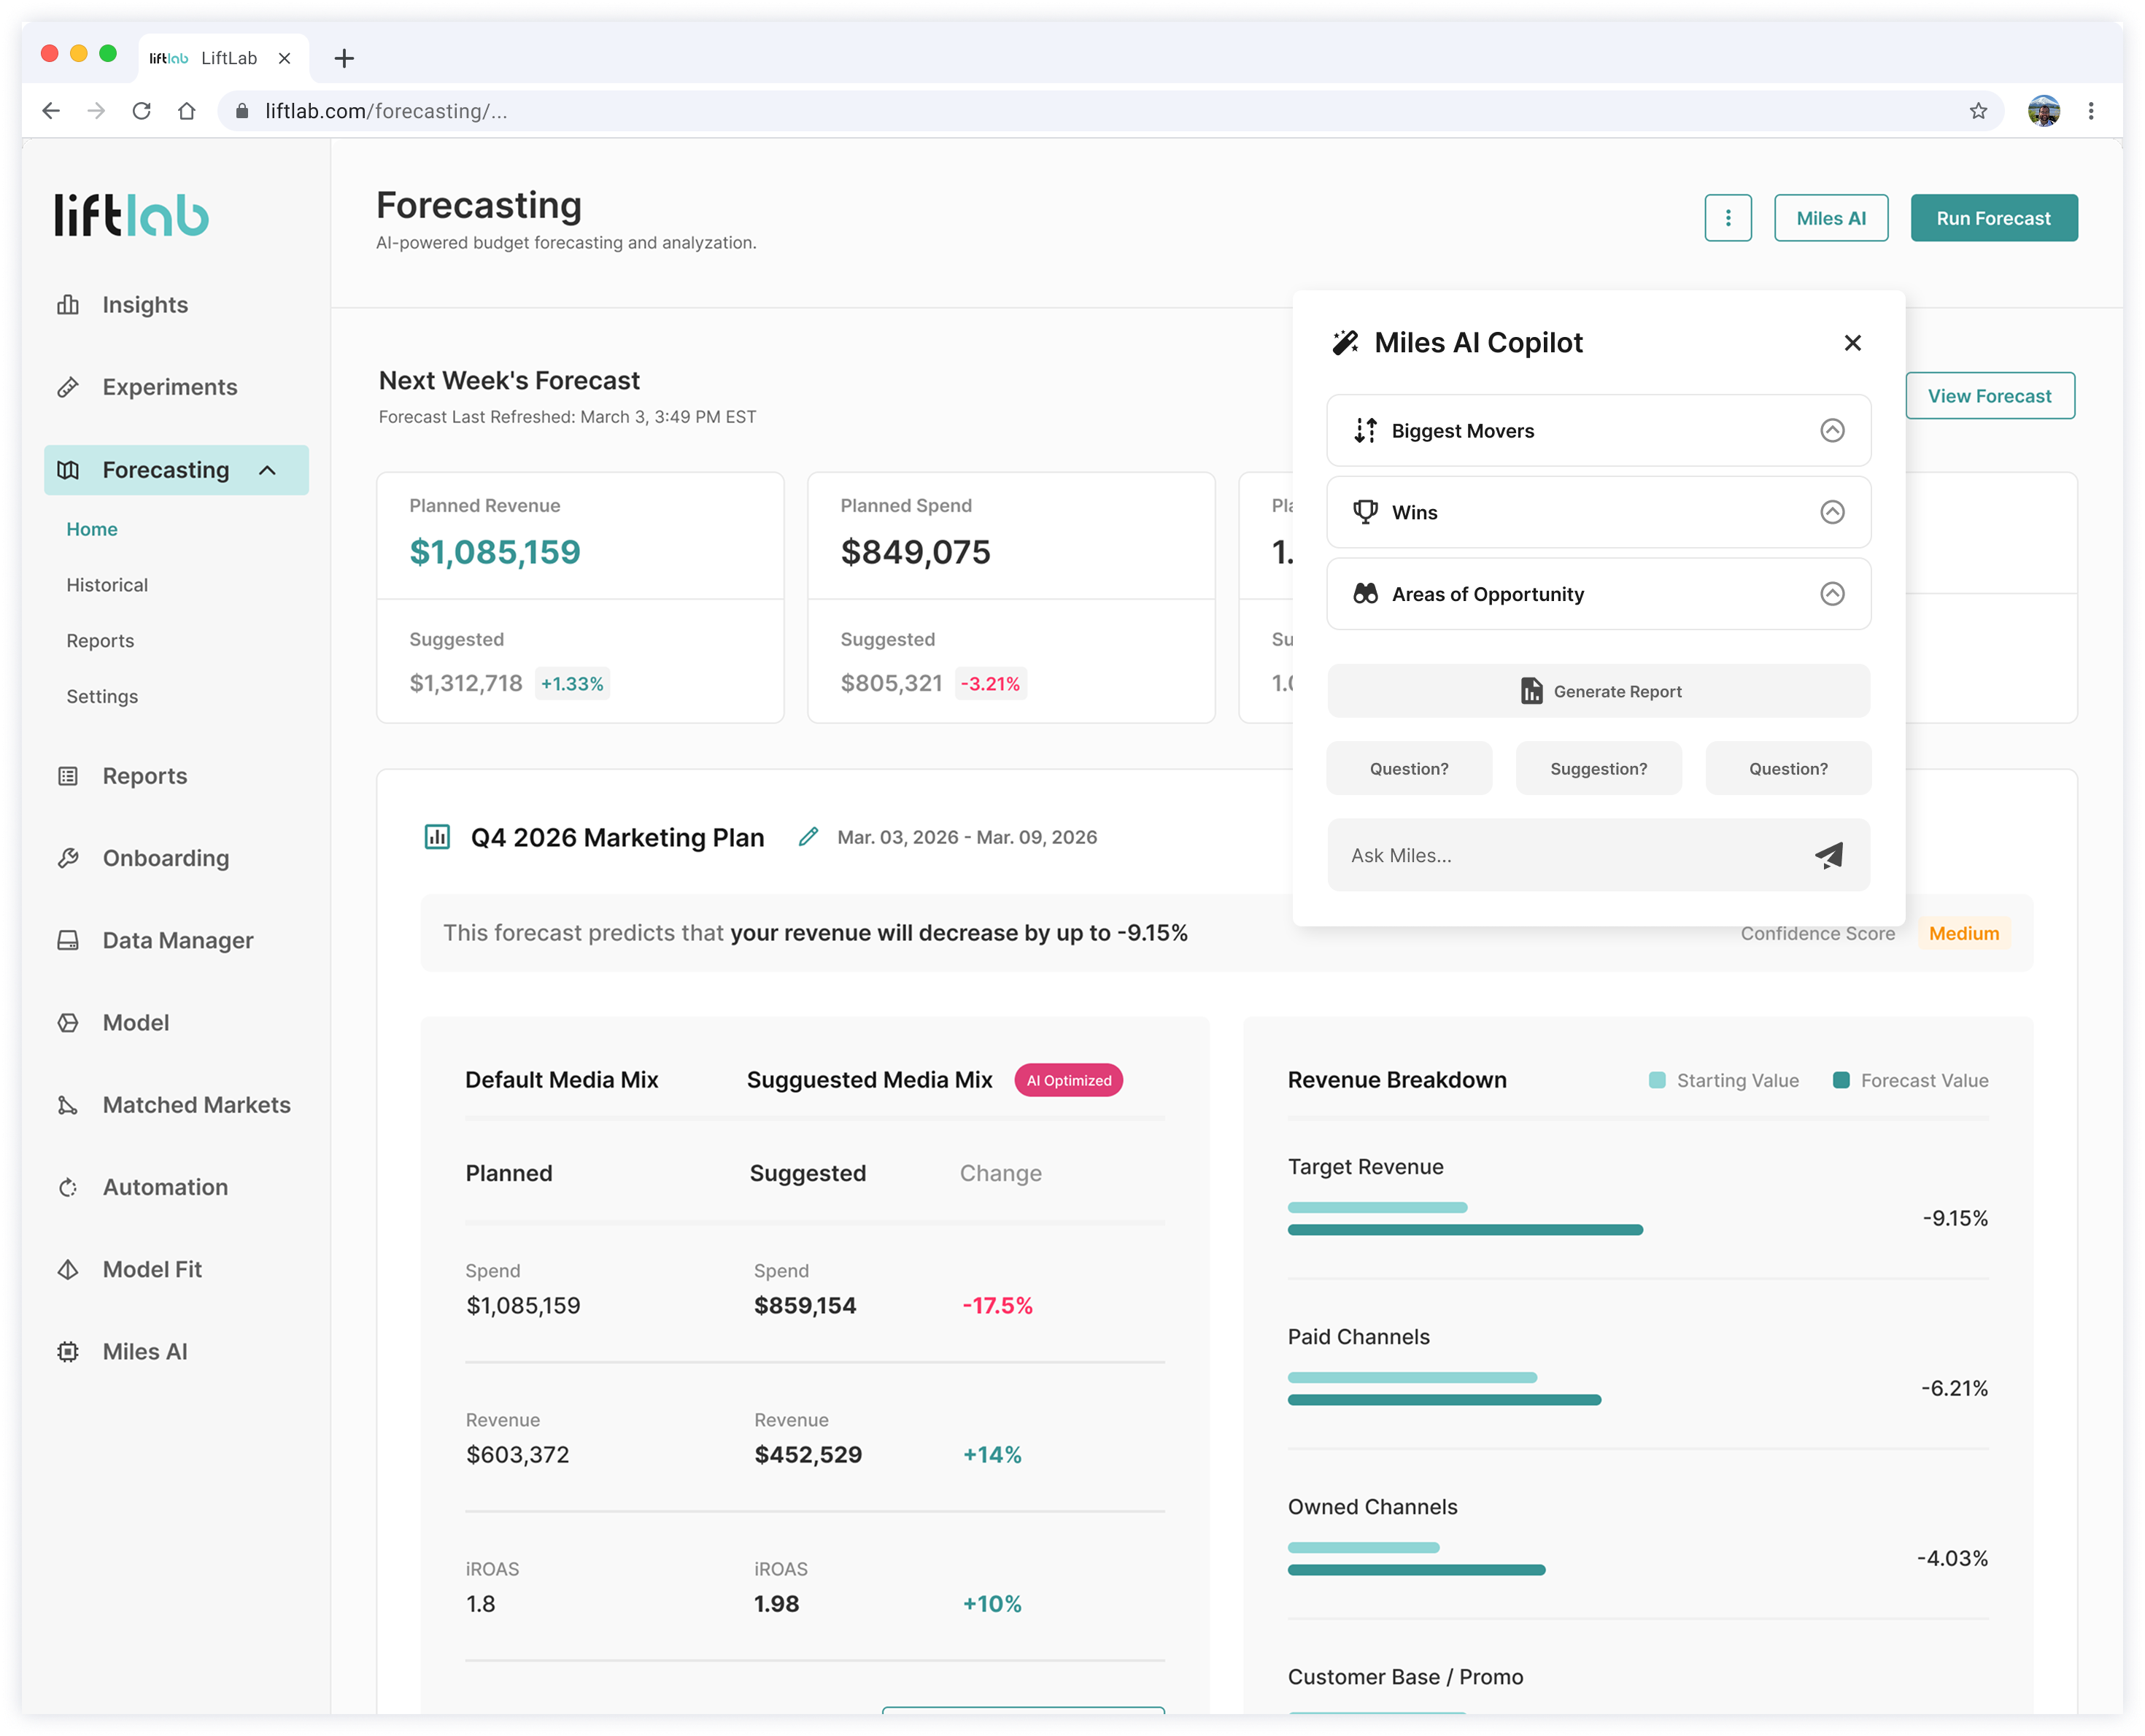
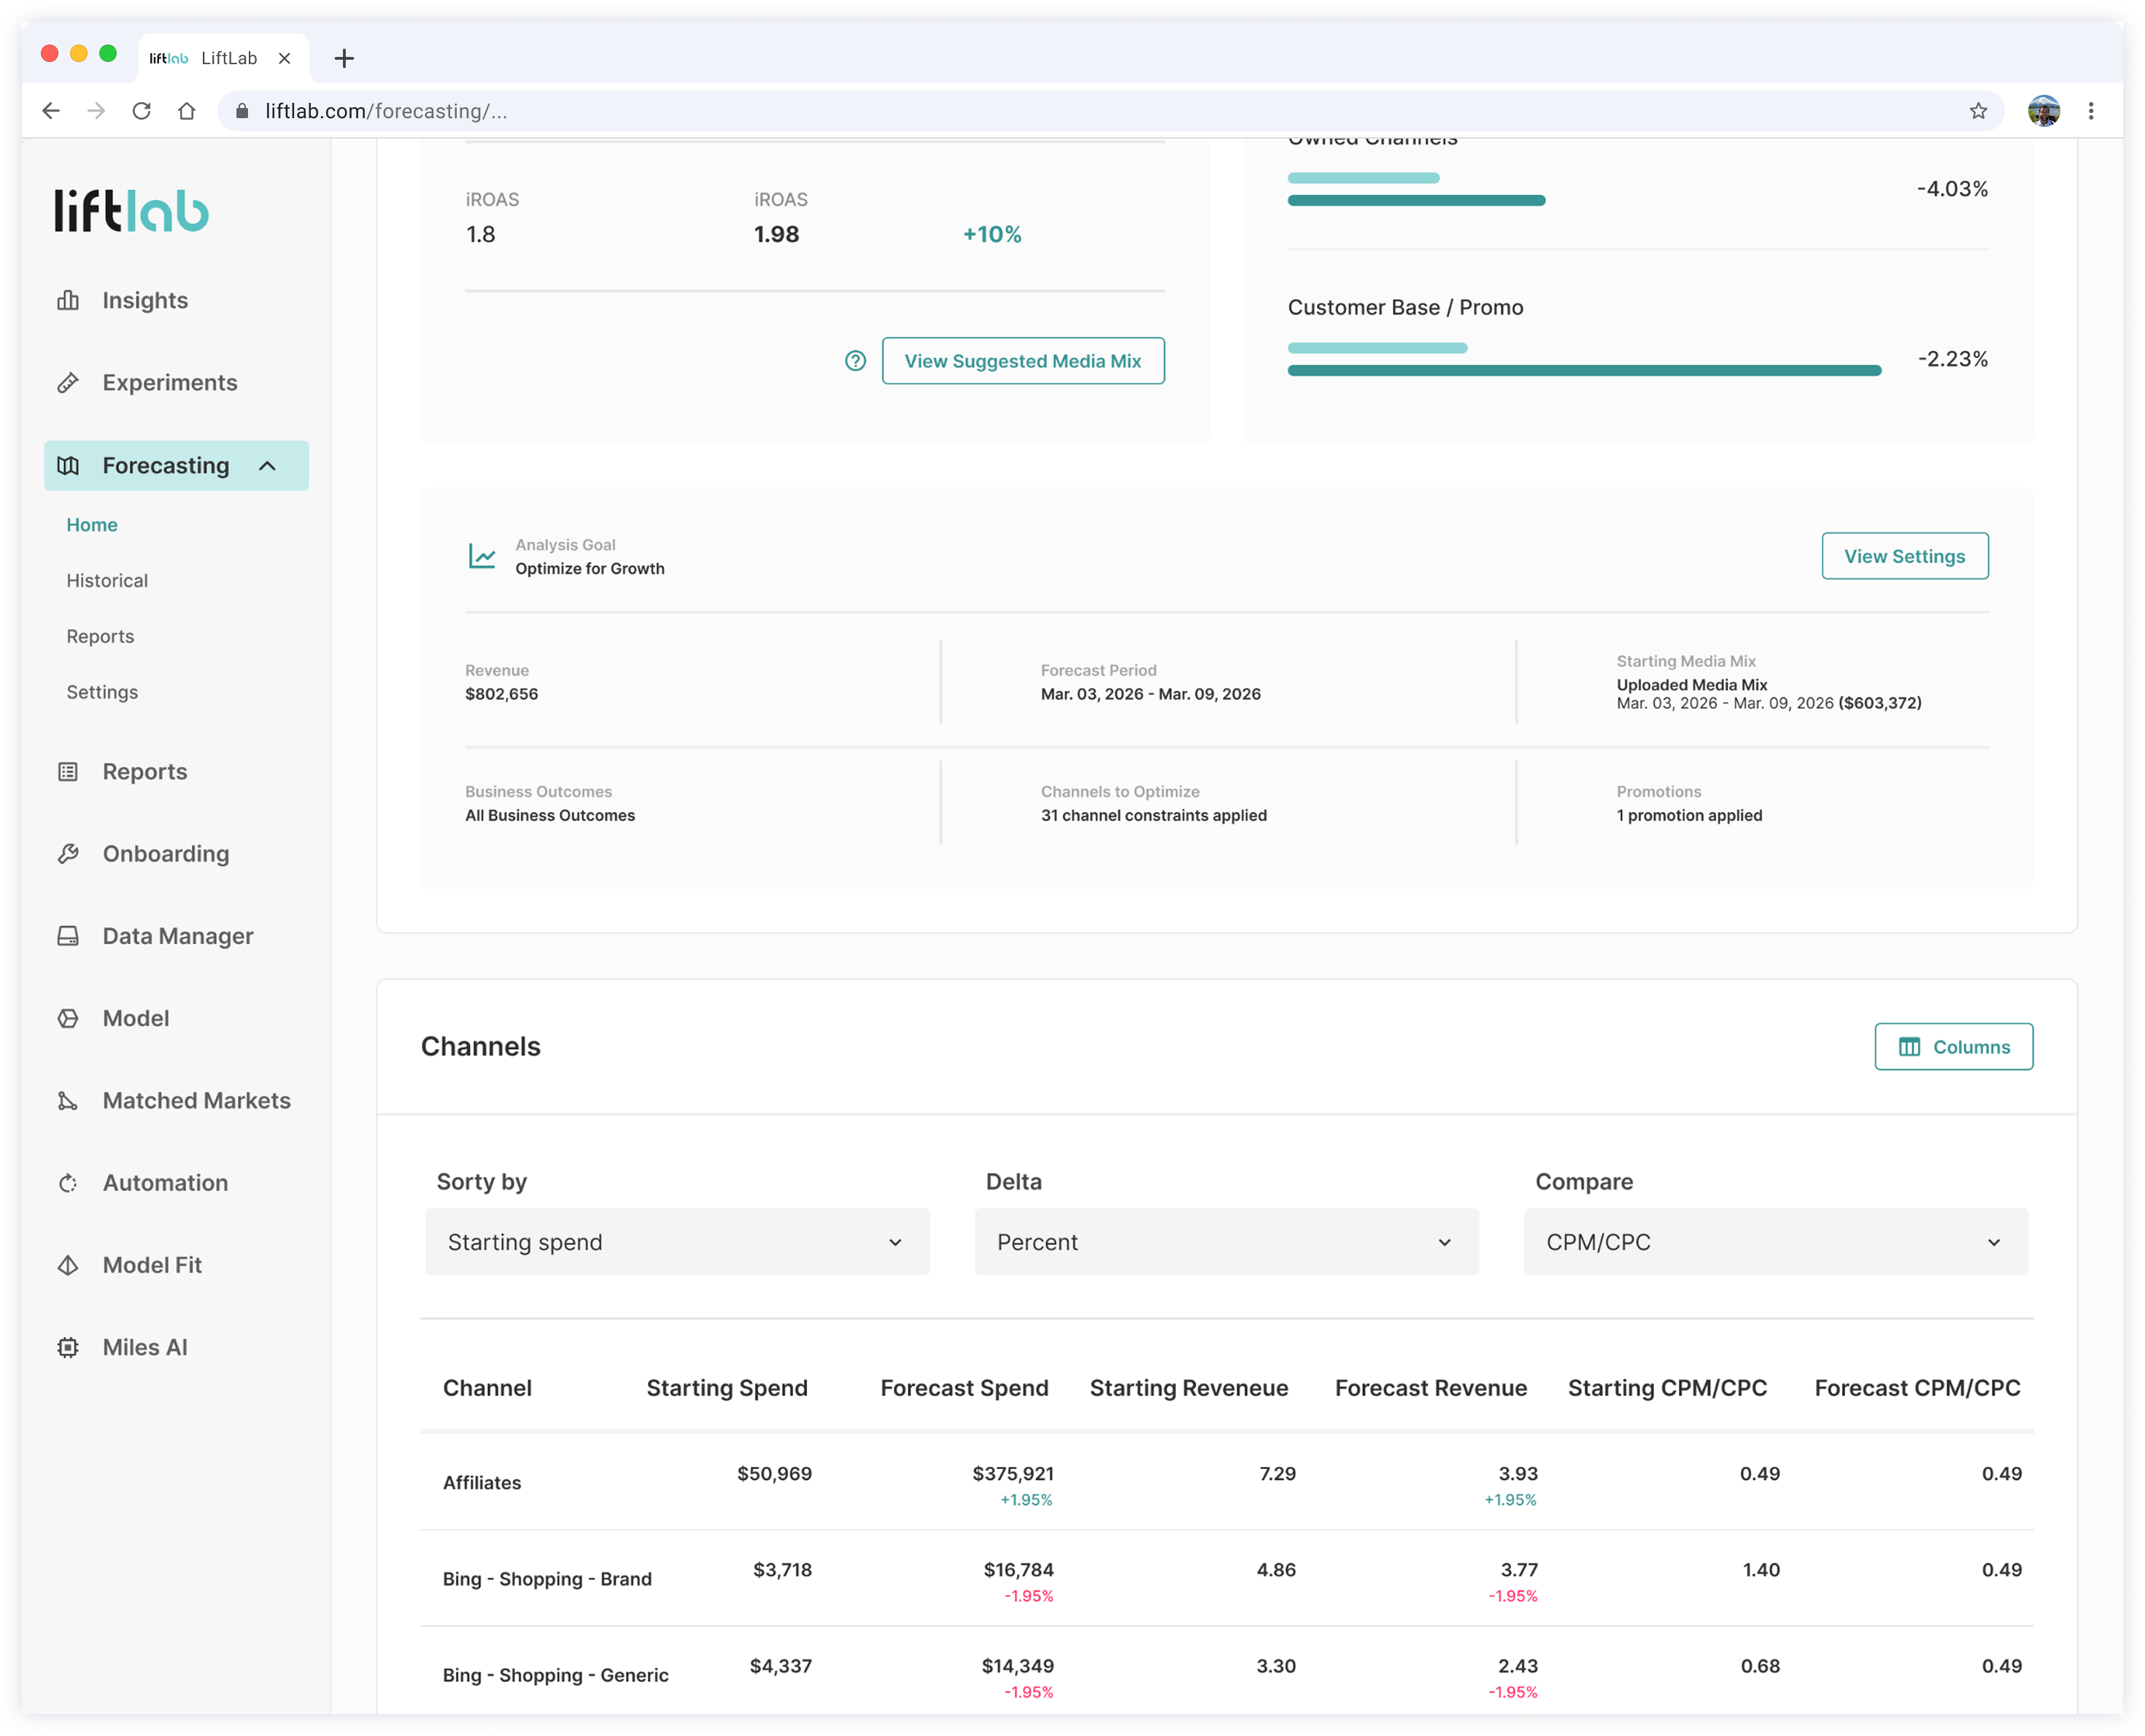
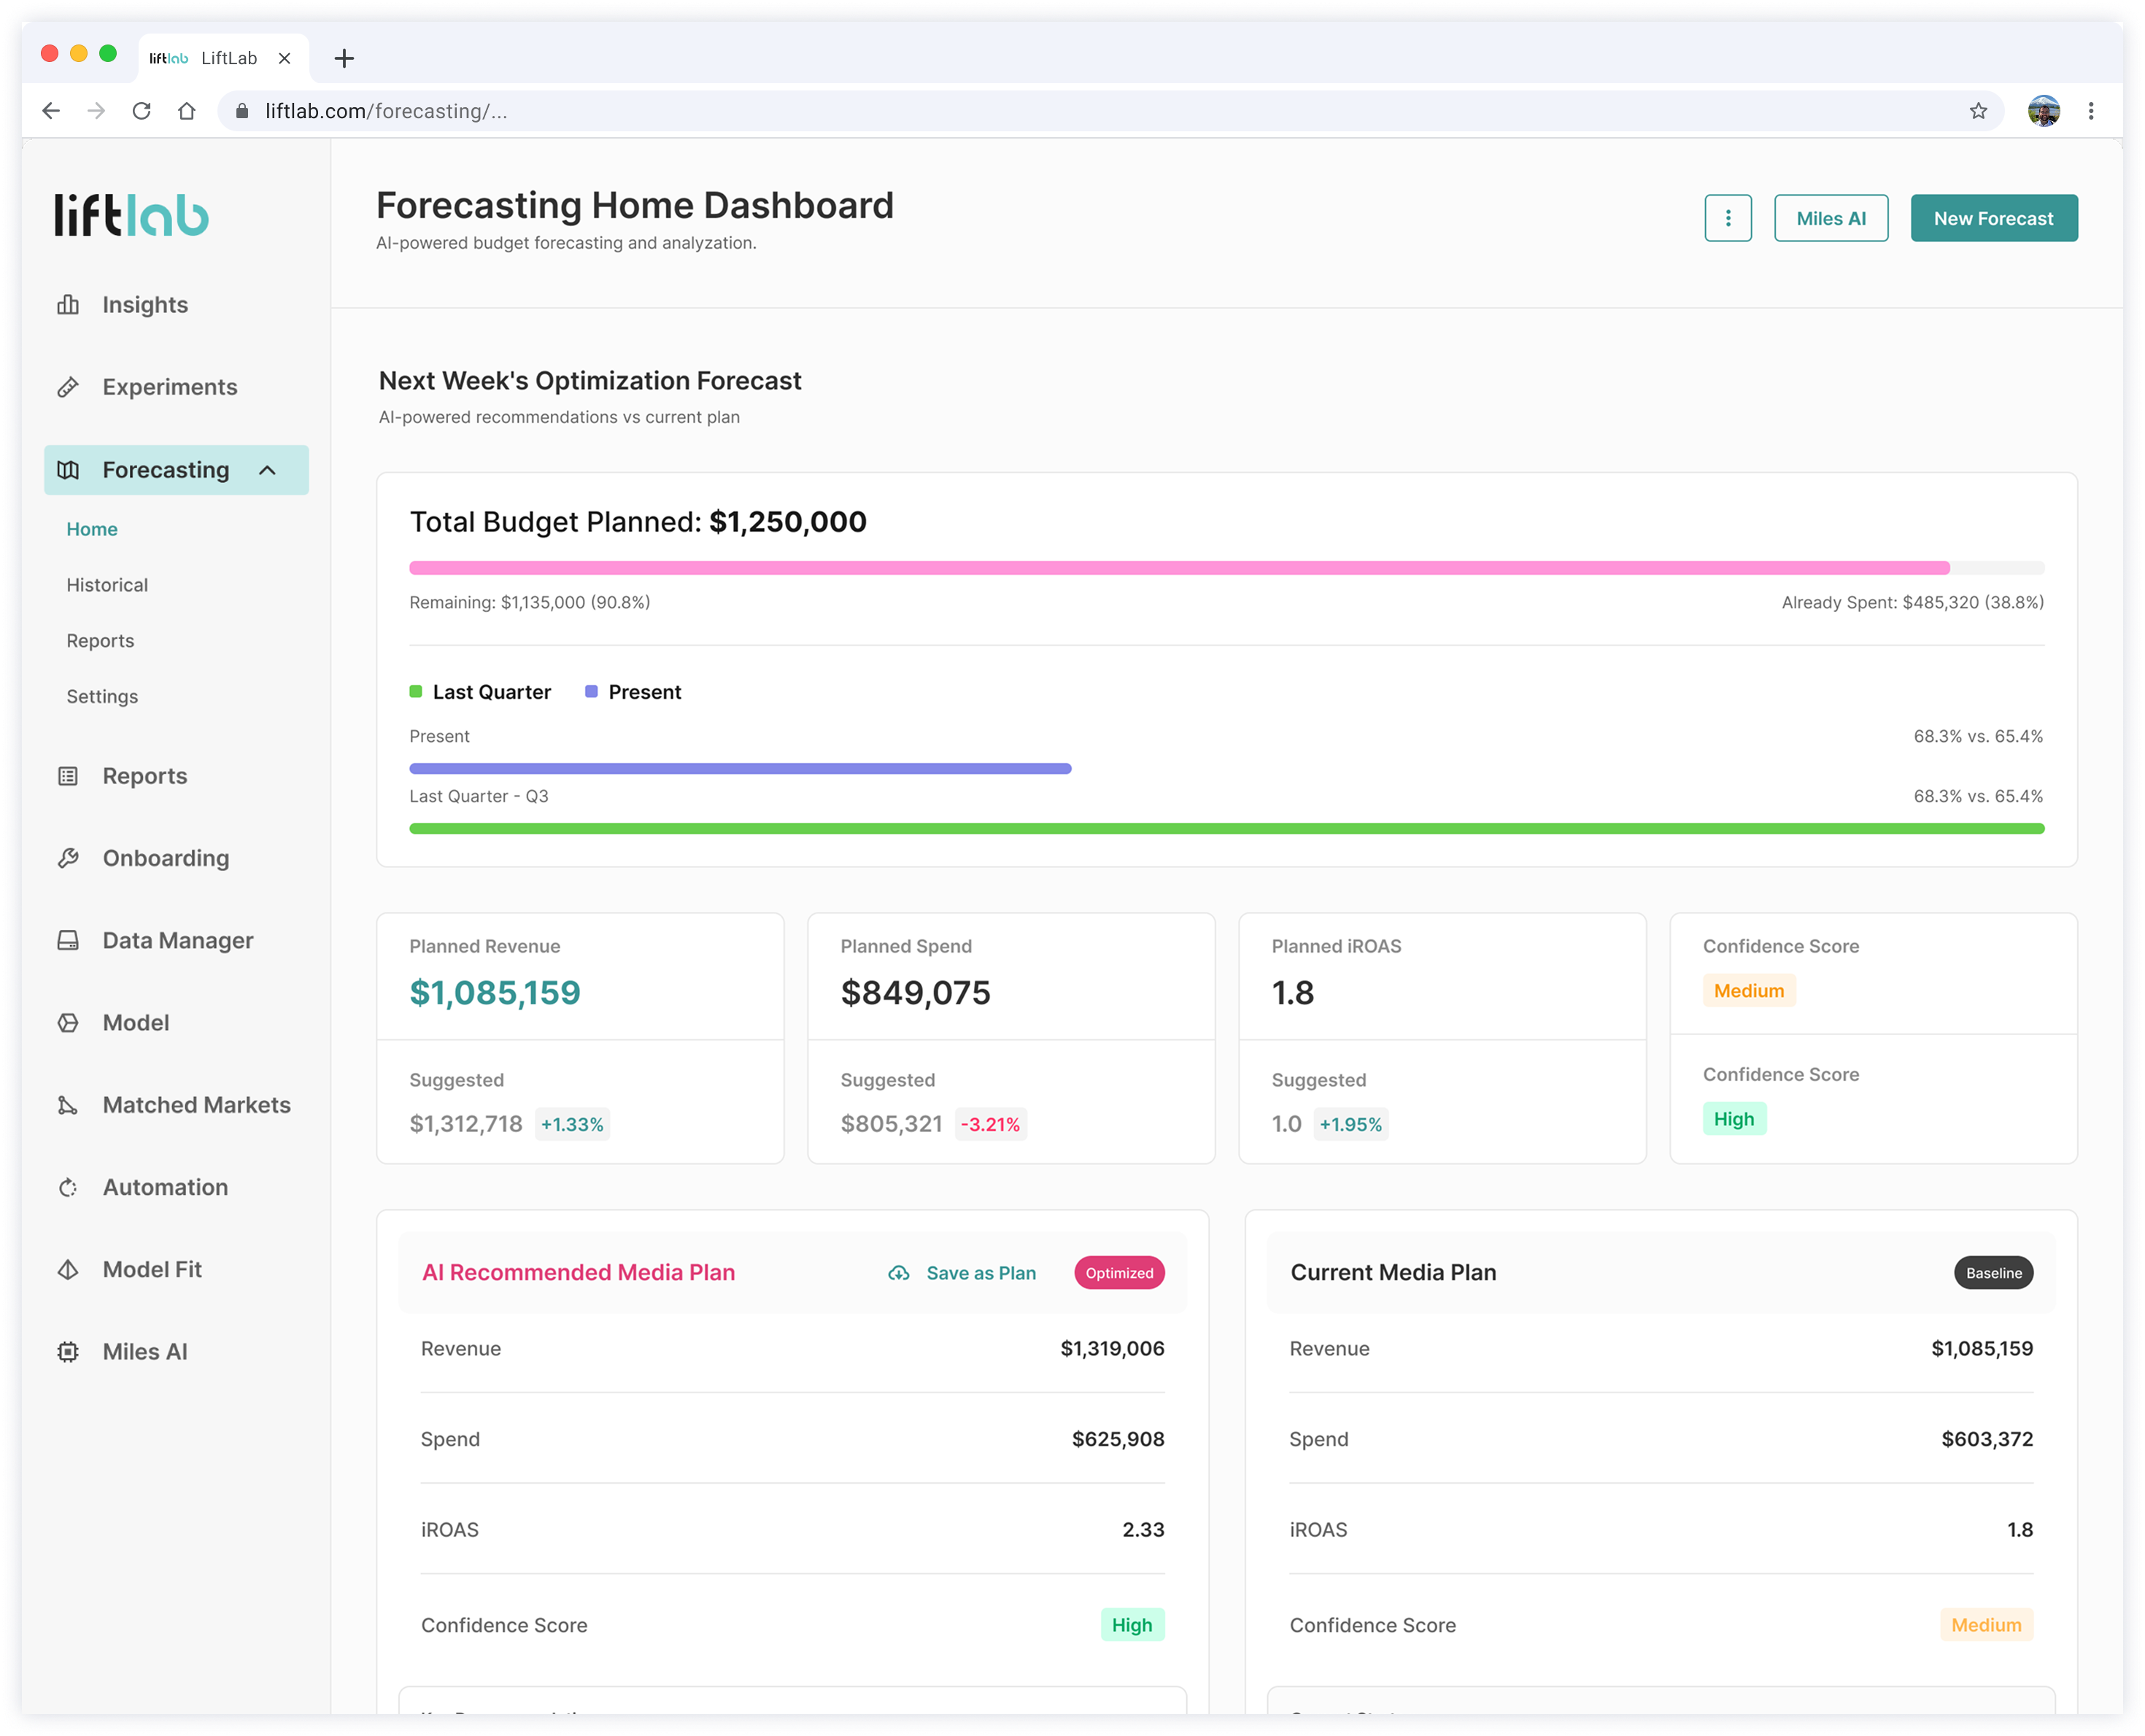
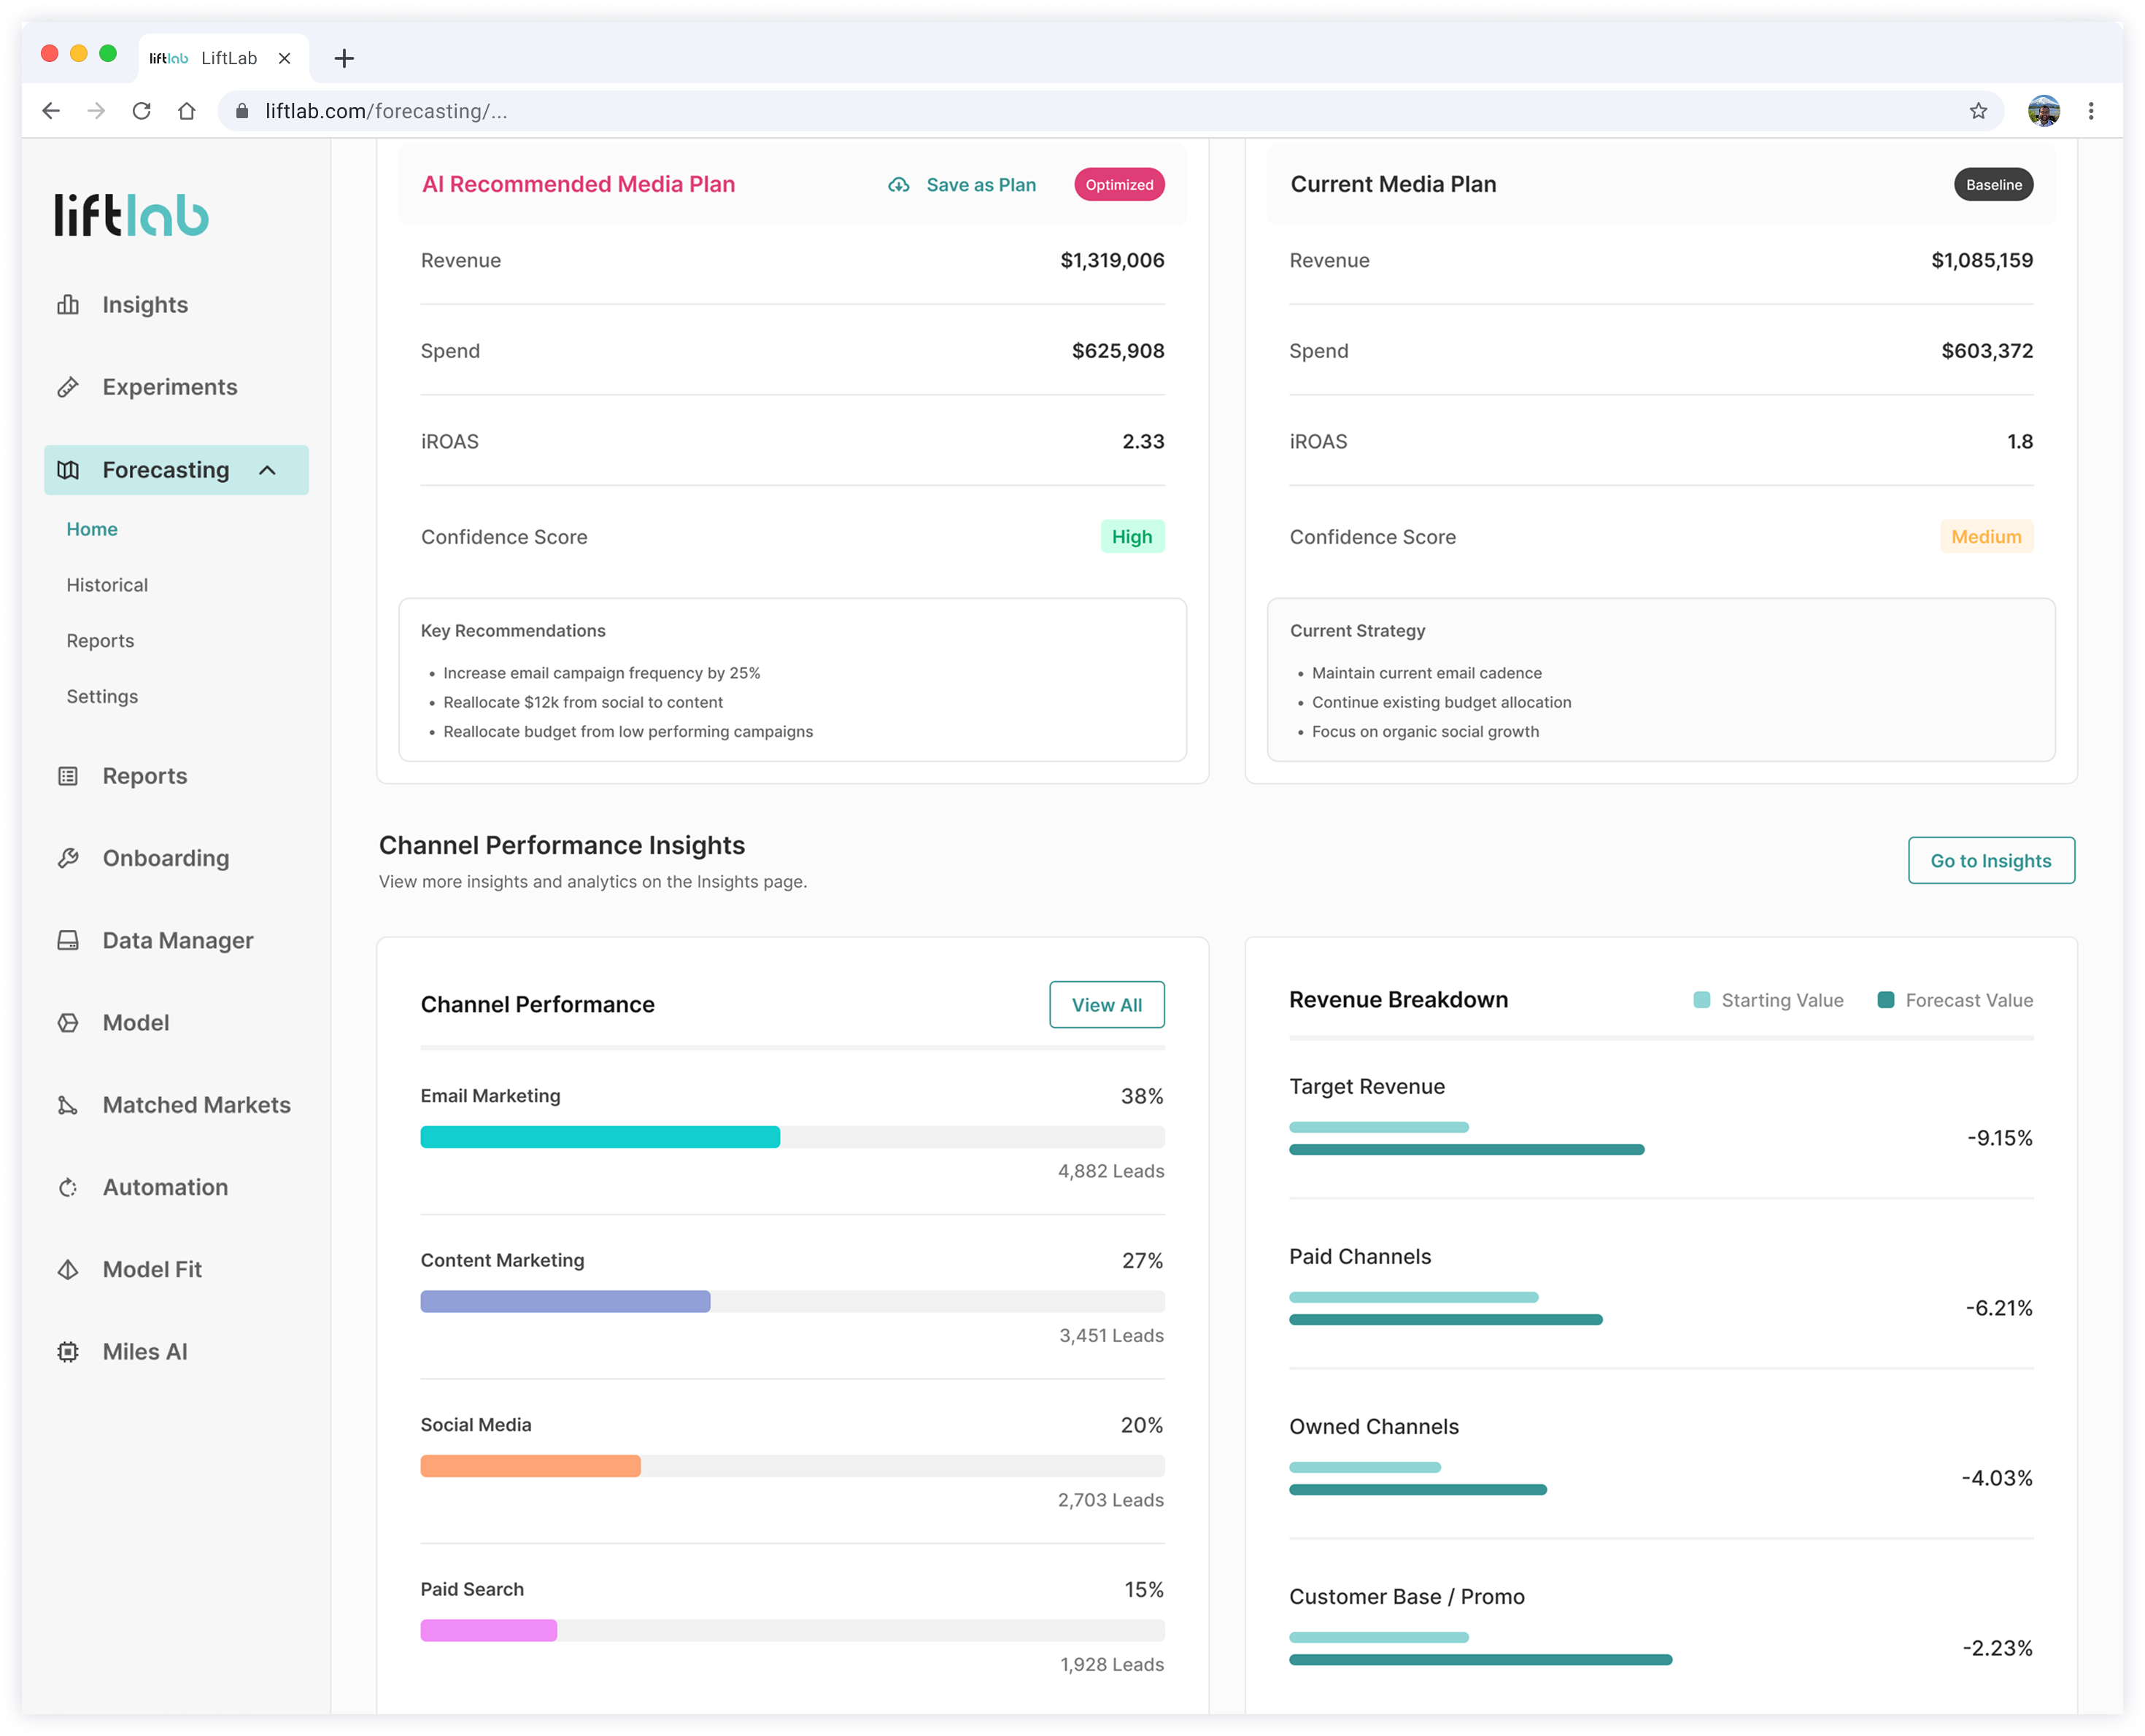
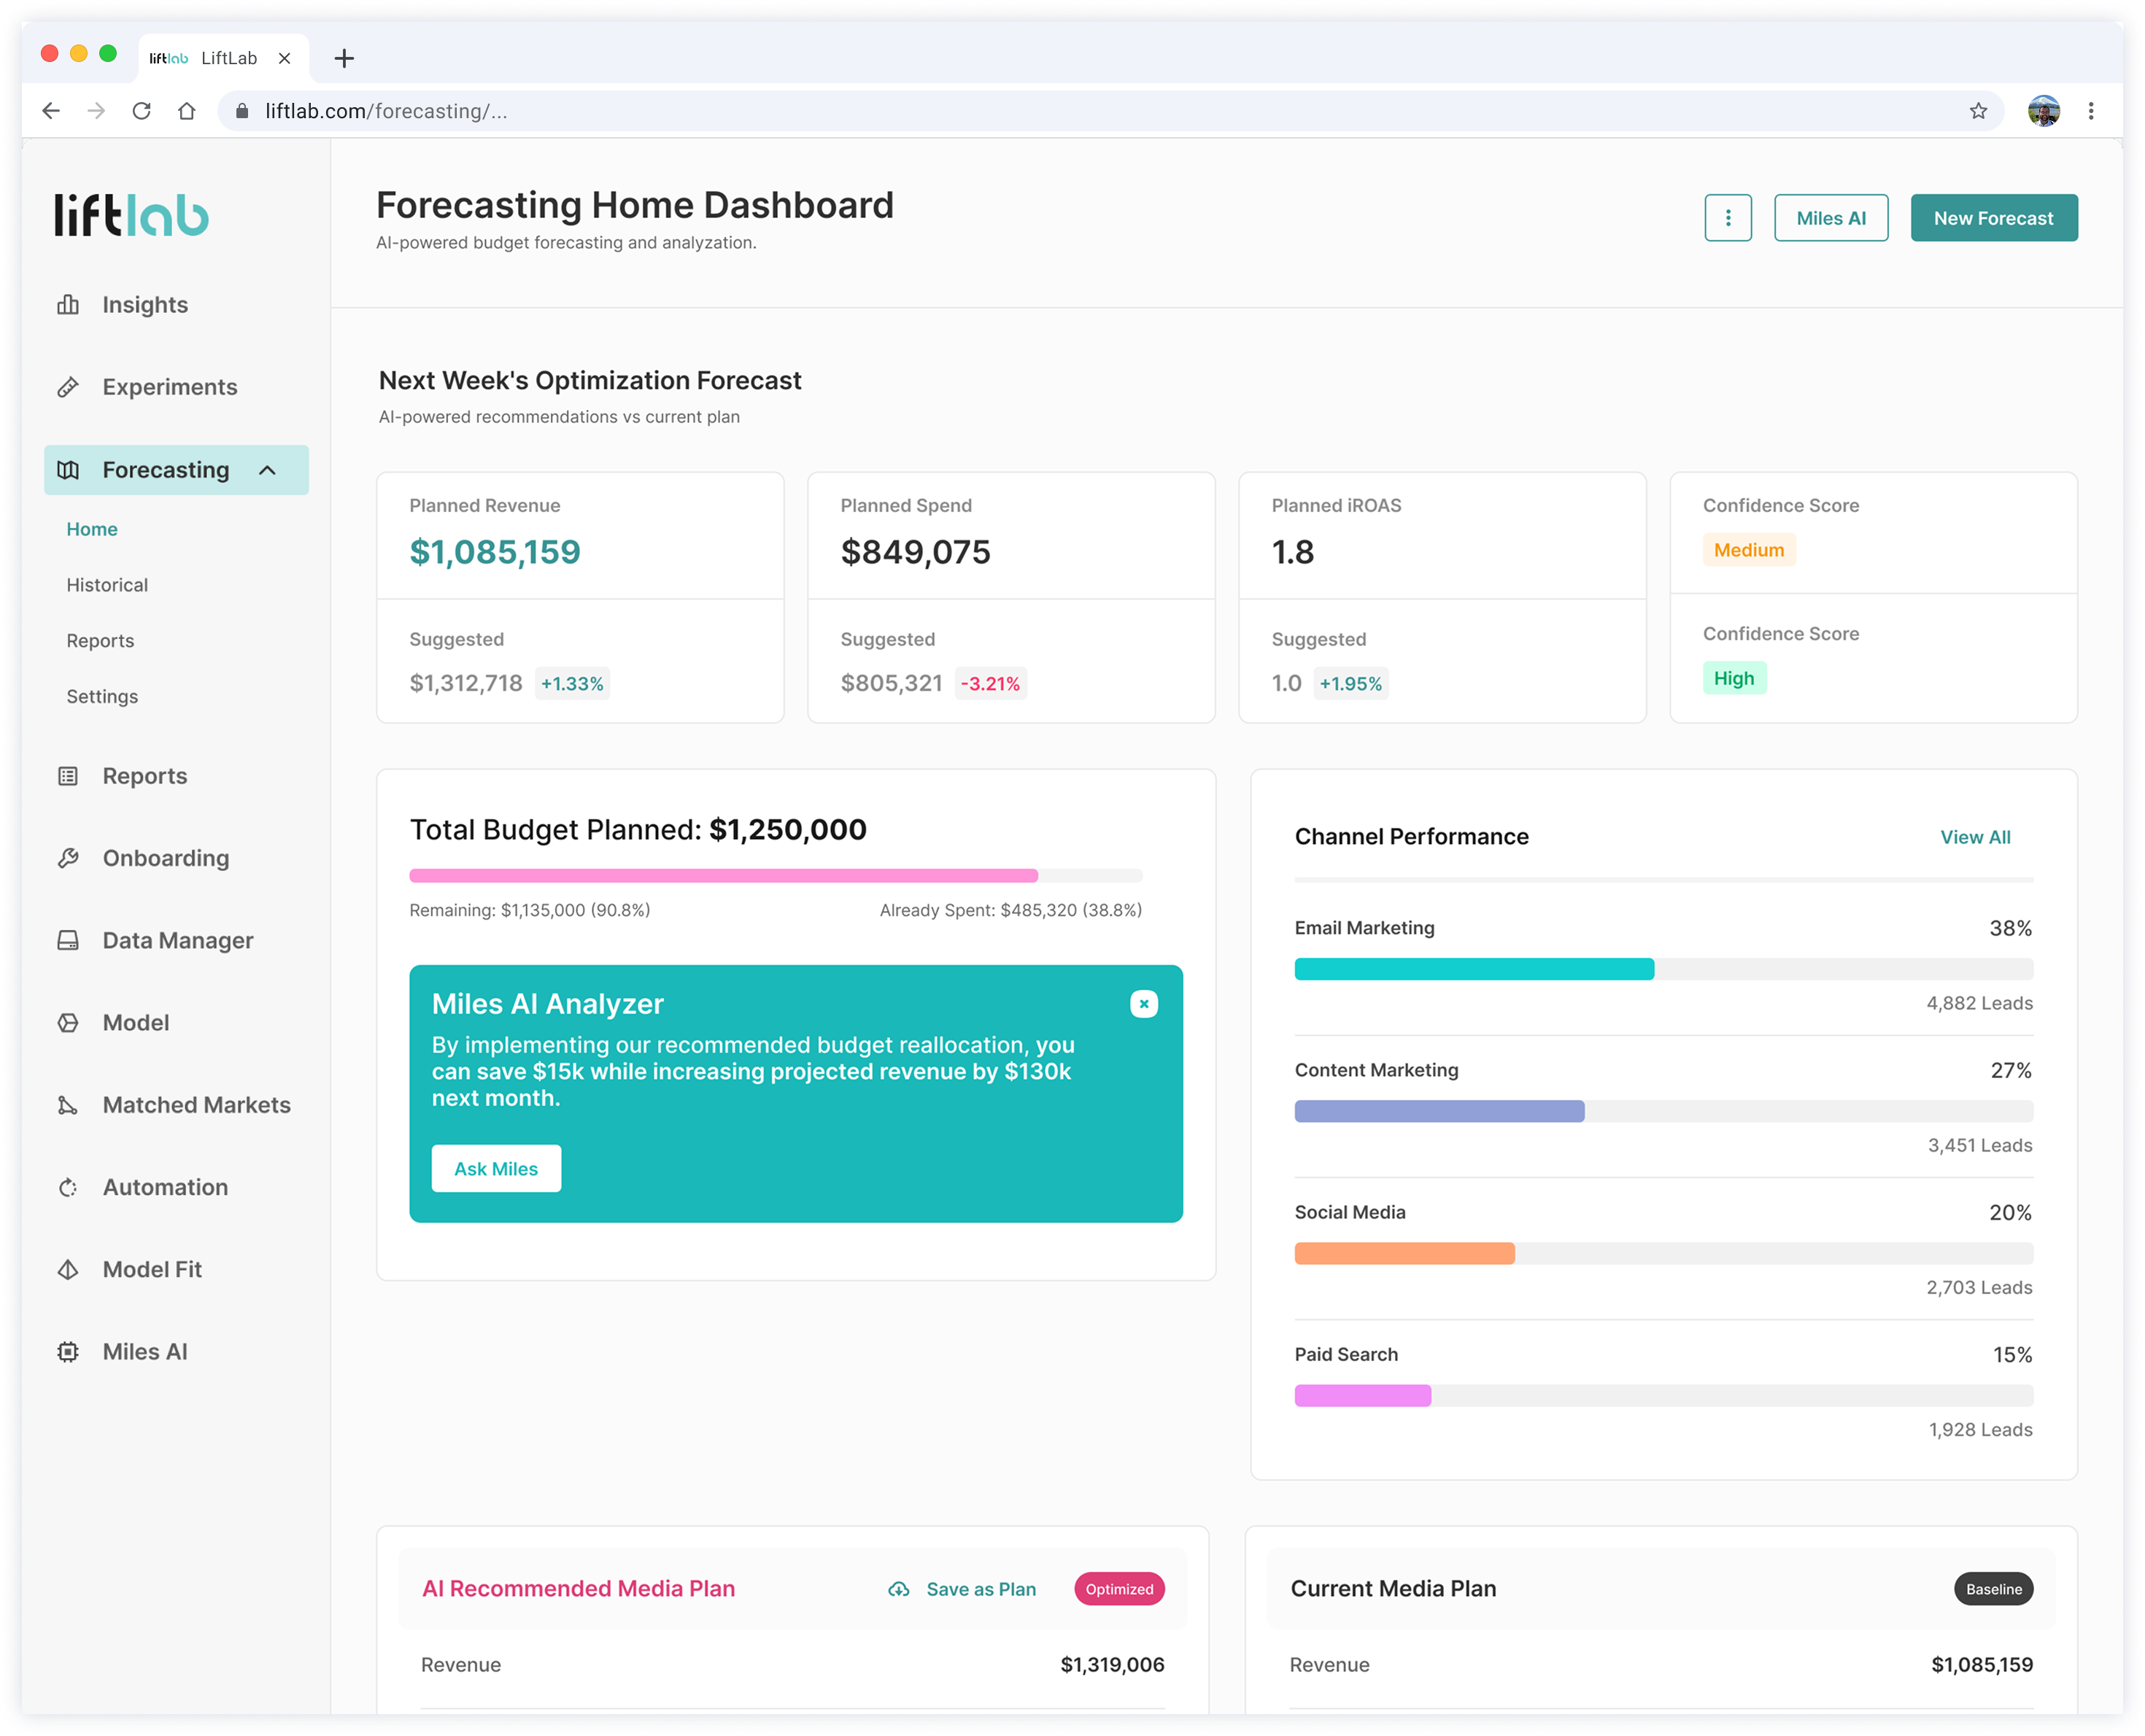
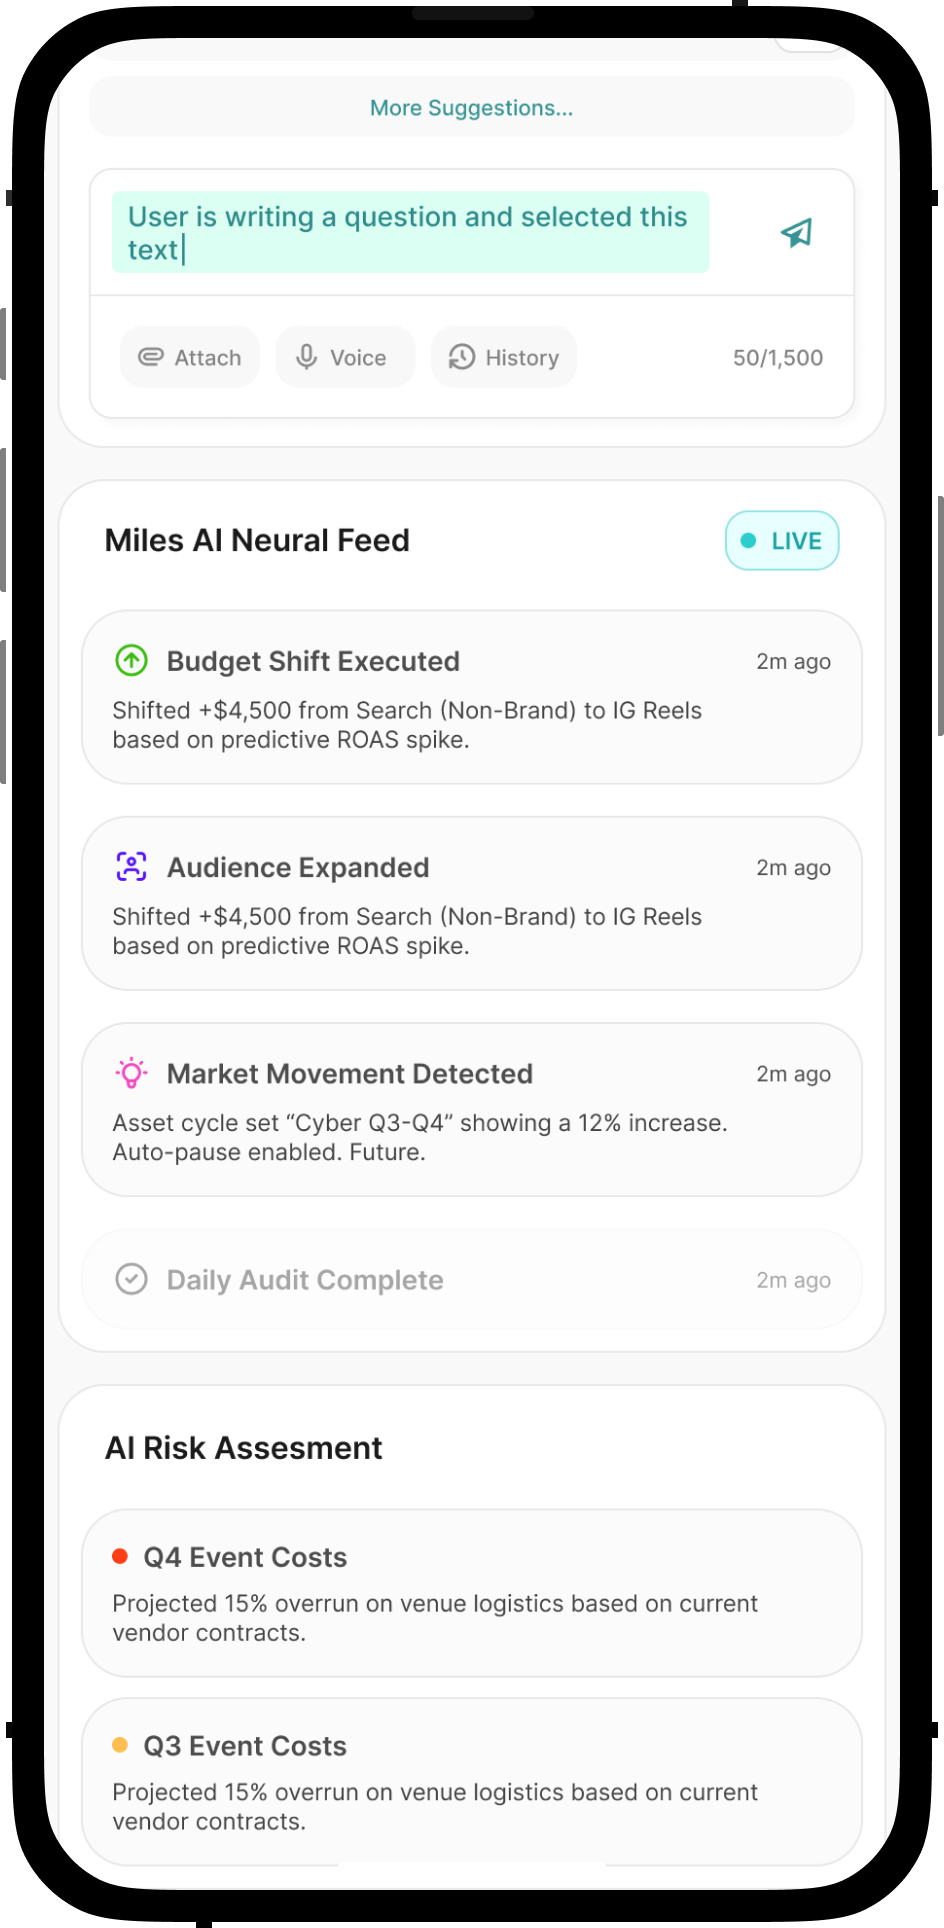


Insights & Analytics Dashboards
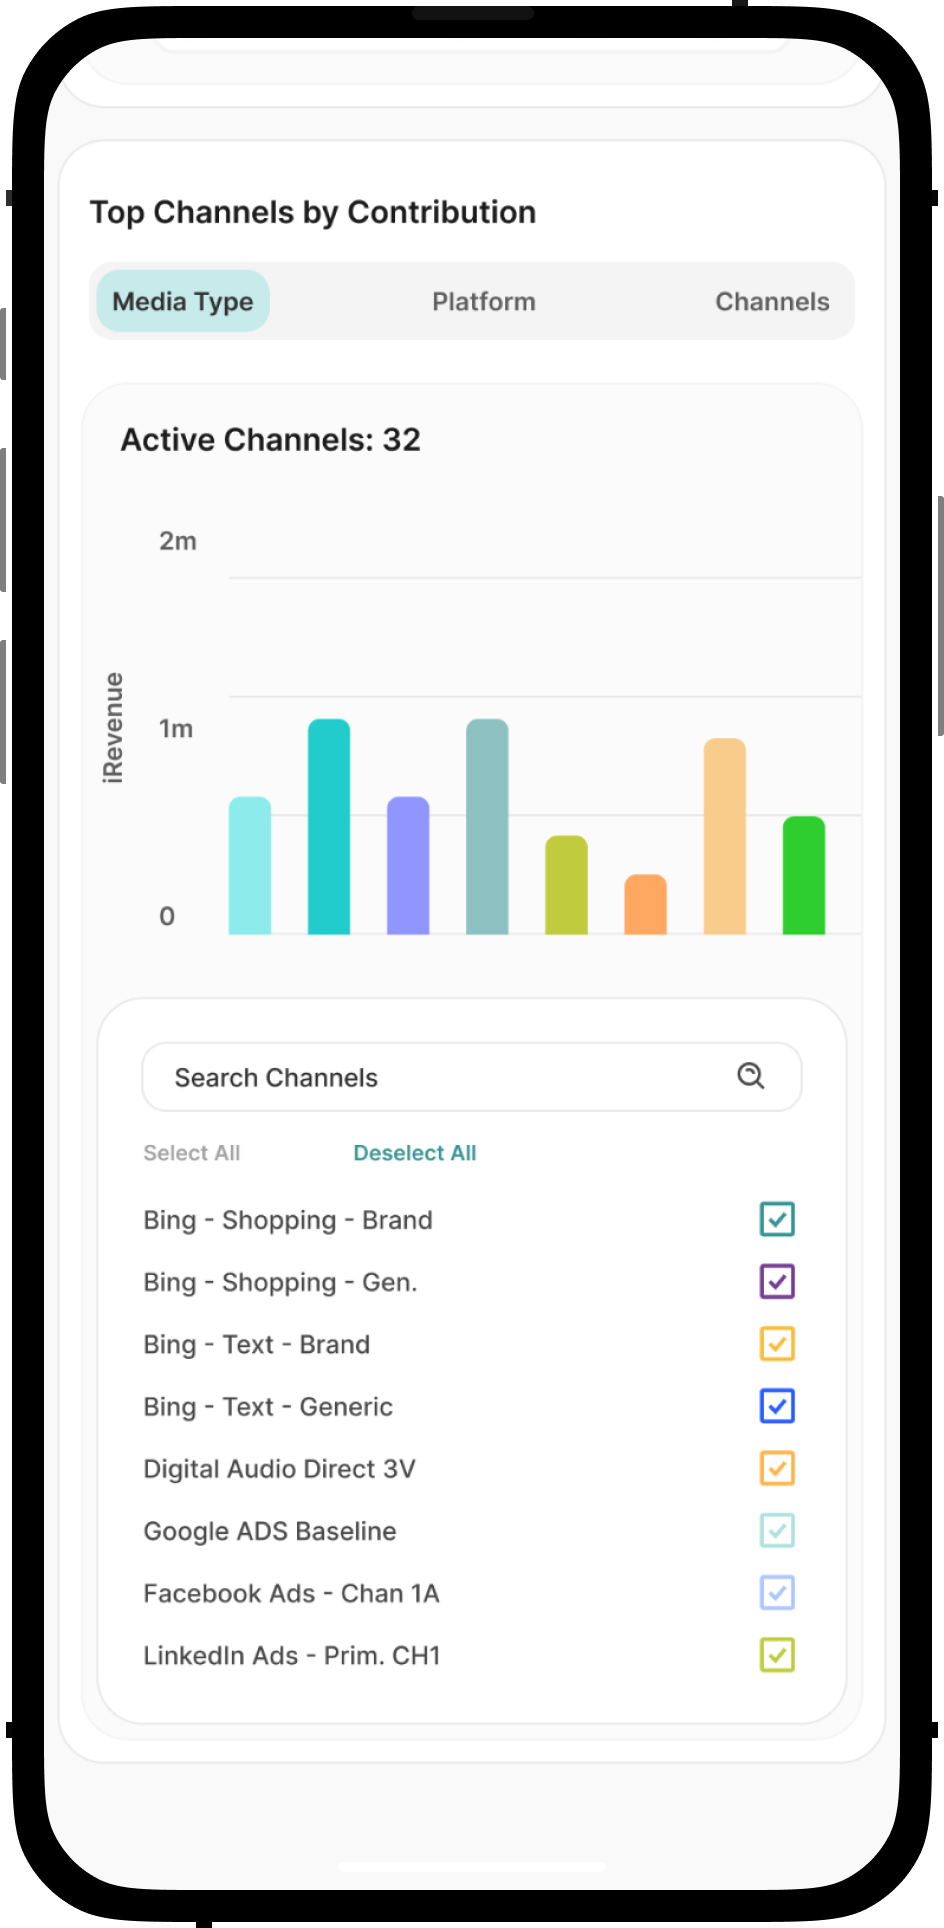
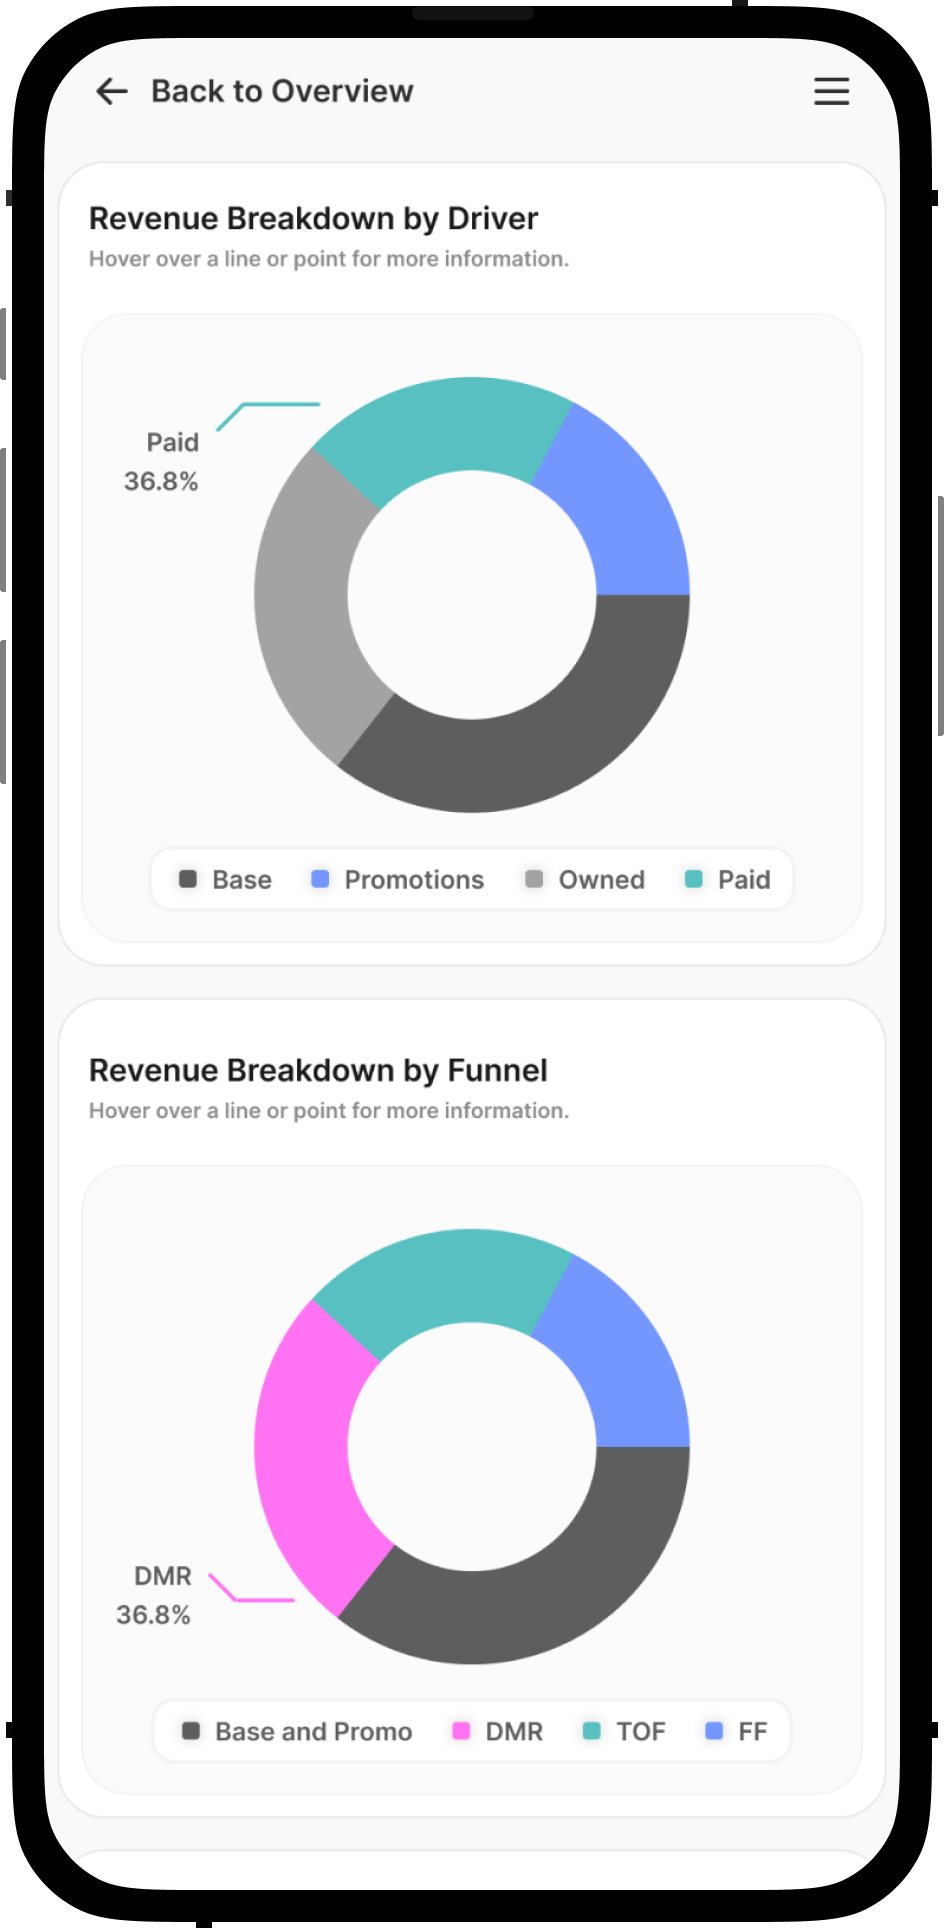
What we were up against
The original tool had accumulated significant usability debt. Through discovery sessions, user interviews, and CSM feedback, four core problem areas emerged that were blocking enterprise adoption and renewal conversations.
Outdated UX & Design System
The original forecasting tool was built on an old design system with missing components, no usability documentation, and inconsistent visual language across screens.
Slow Process
Missing functionality like editing advanced settings before running a forecast forced teams into slow, manual workarounds — sometimes taking 3–4 days per budget cycle.
No Guidance or Guardrails
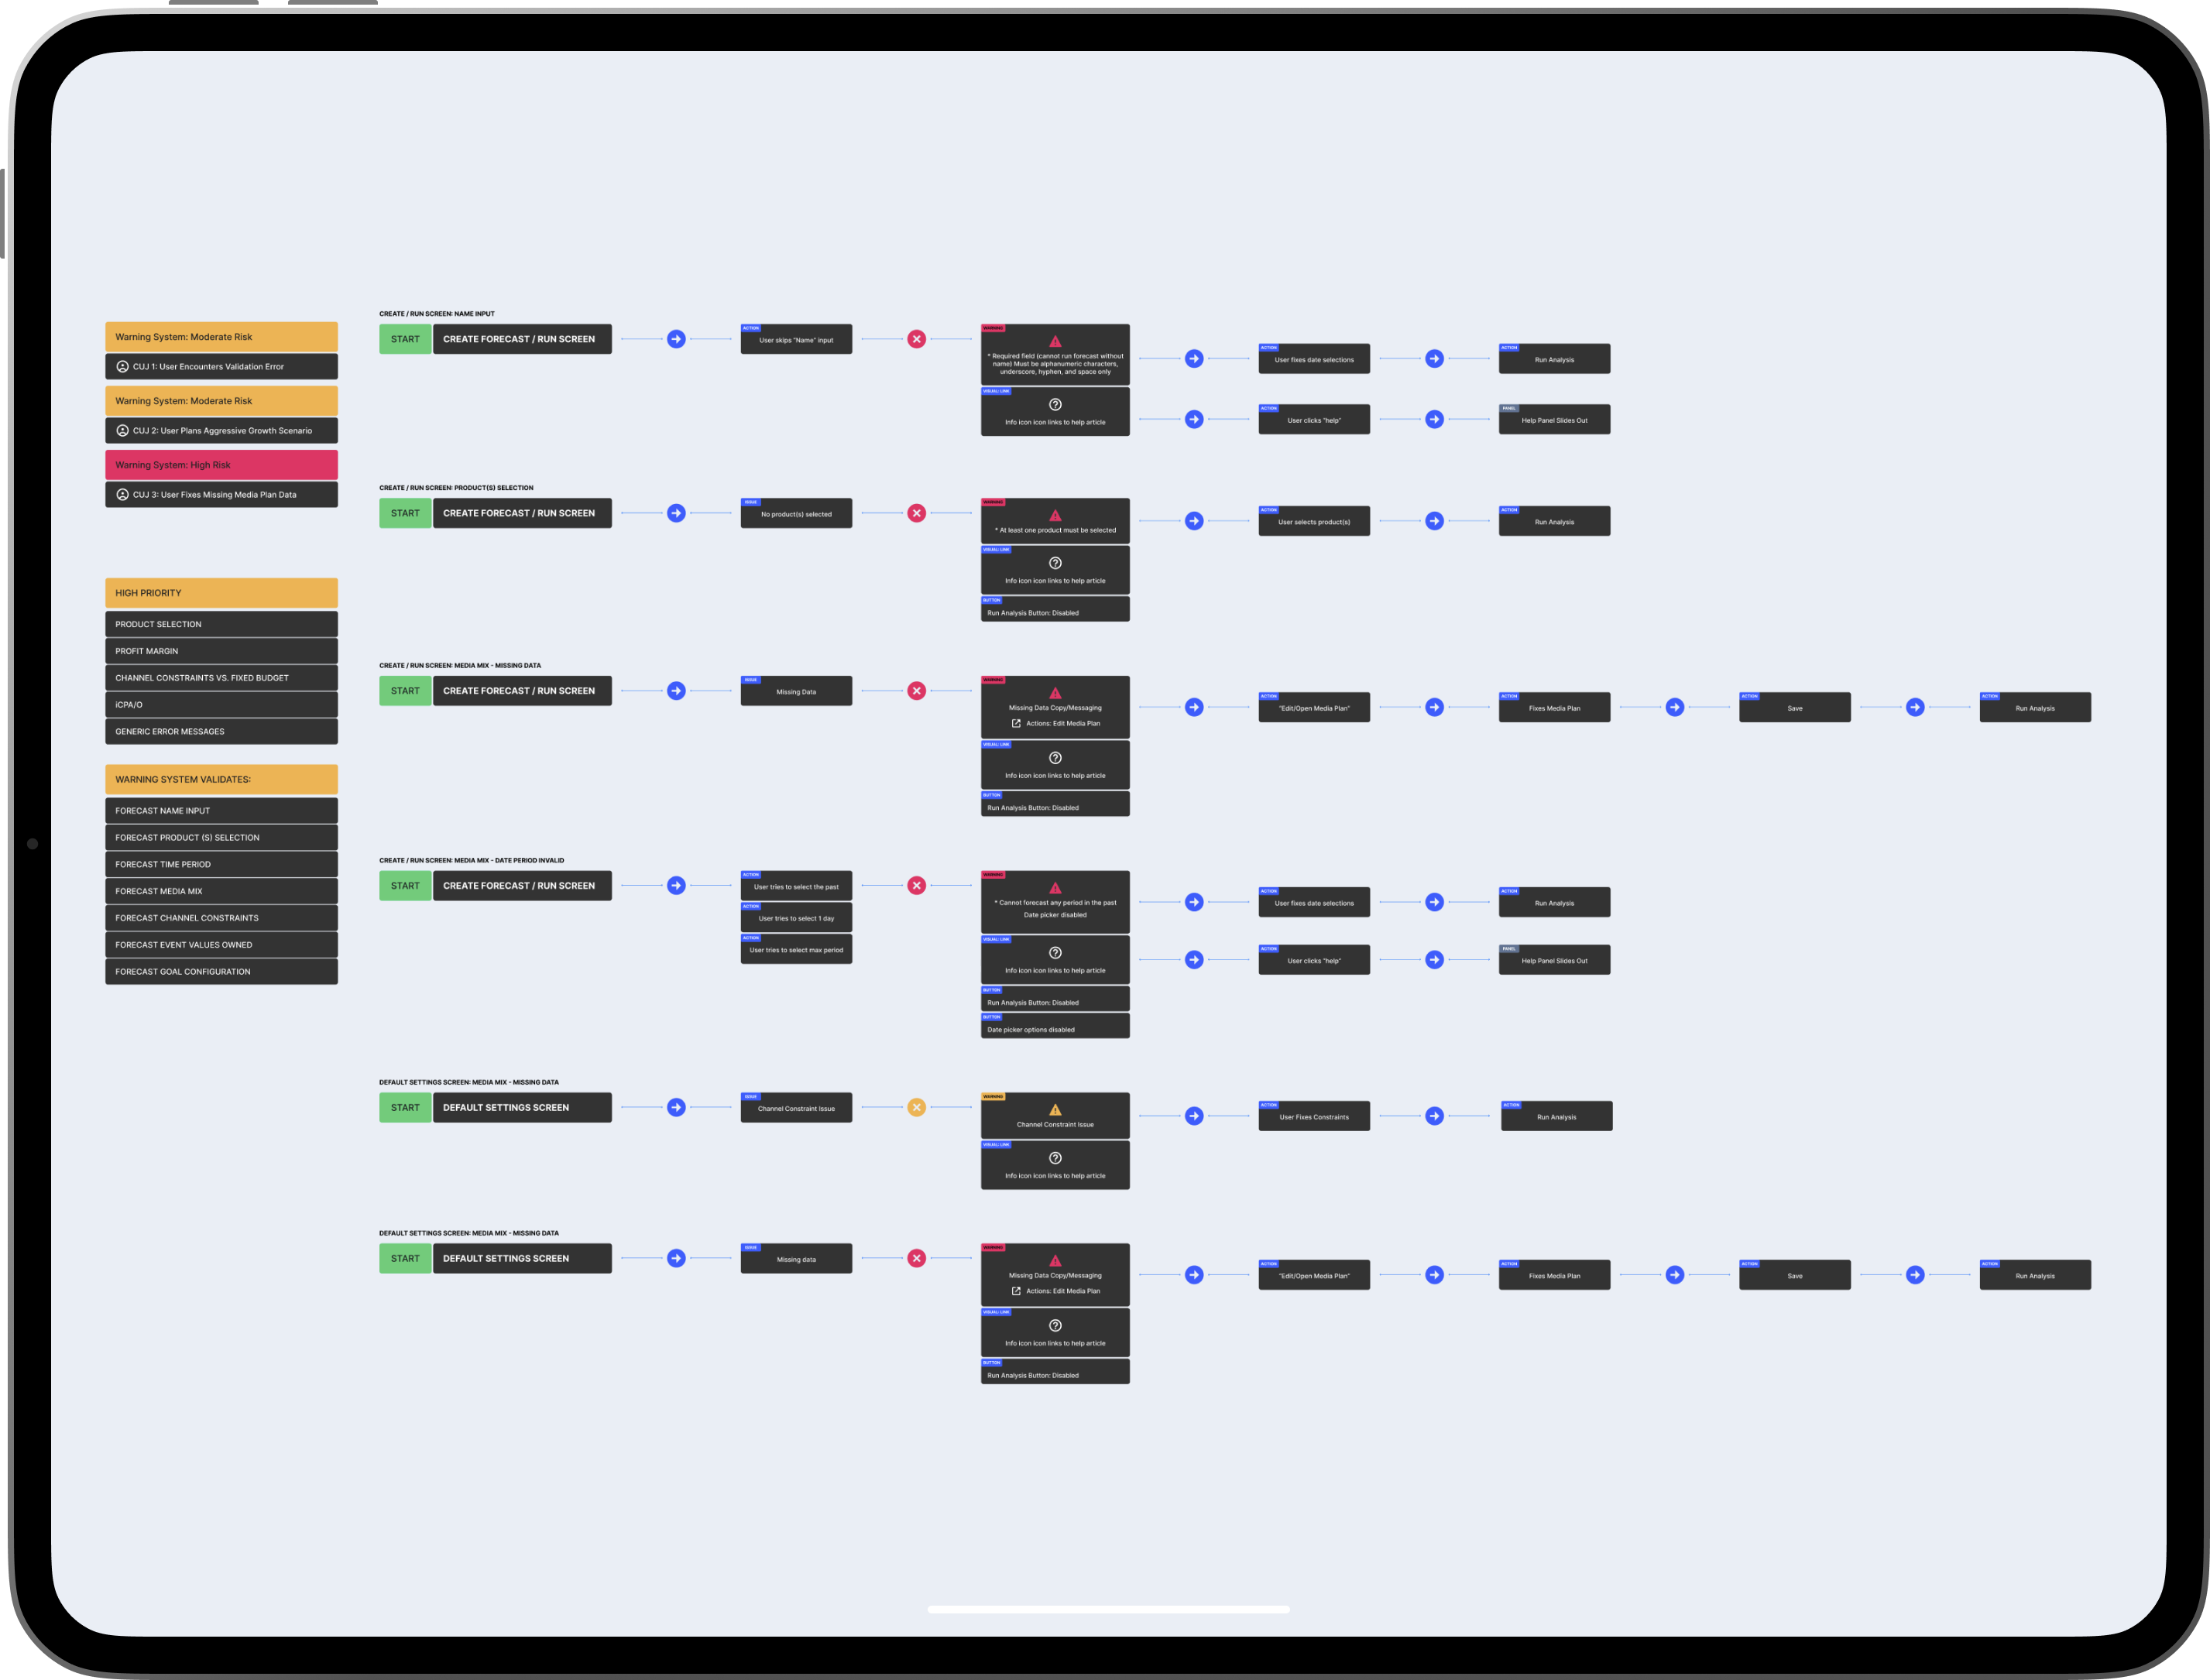
The old tool allowed users to seriously misconfigure budget and spending allocations without any warnings, blockers, validation, or confirmation steps.
Not Proactive
Users had no visibility into forecast results unless they manually ran one. We shifted to always showing pre-computed background forecast results on the landing state.
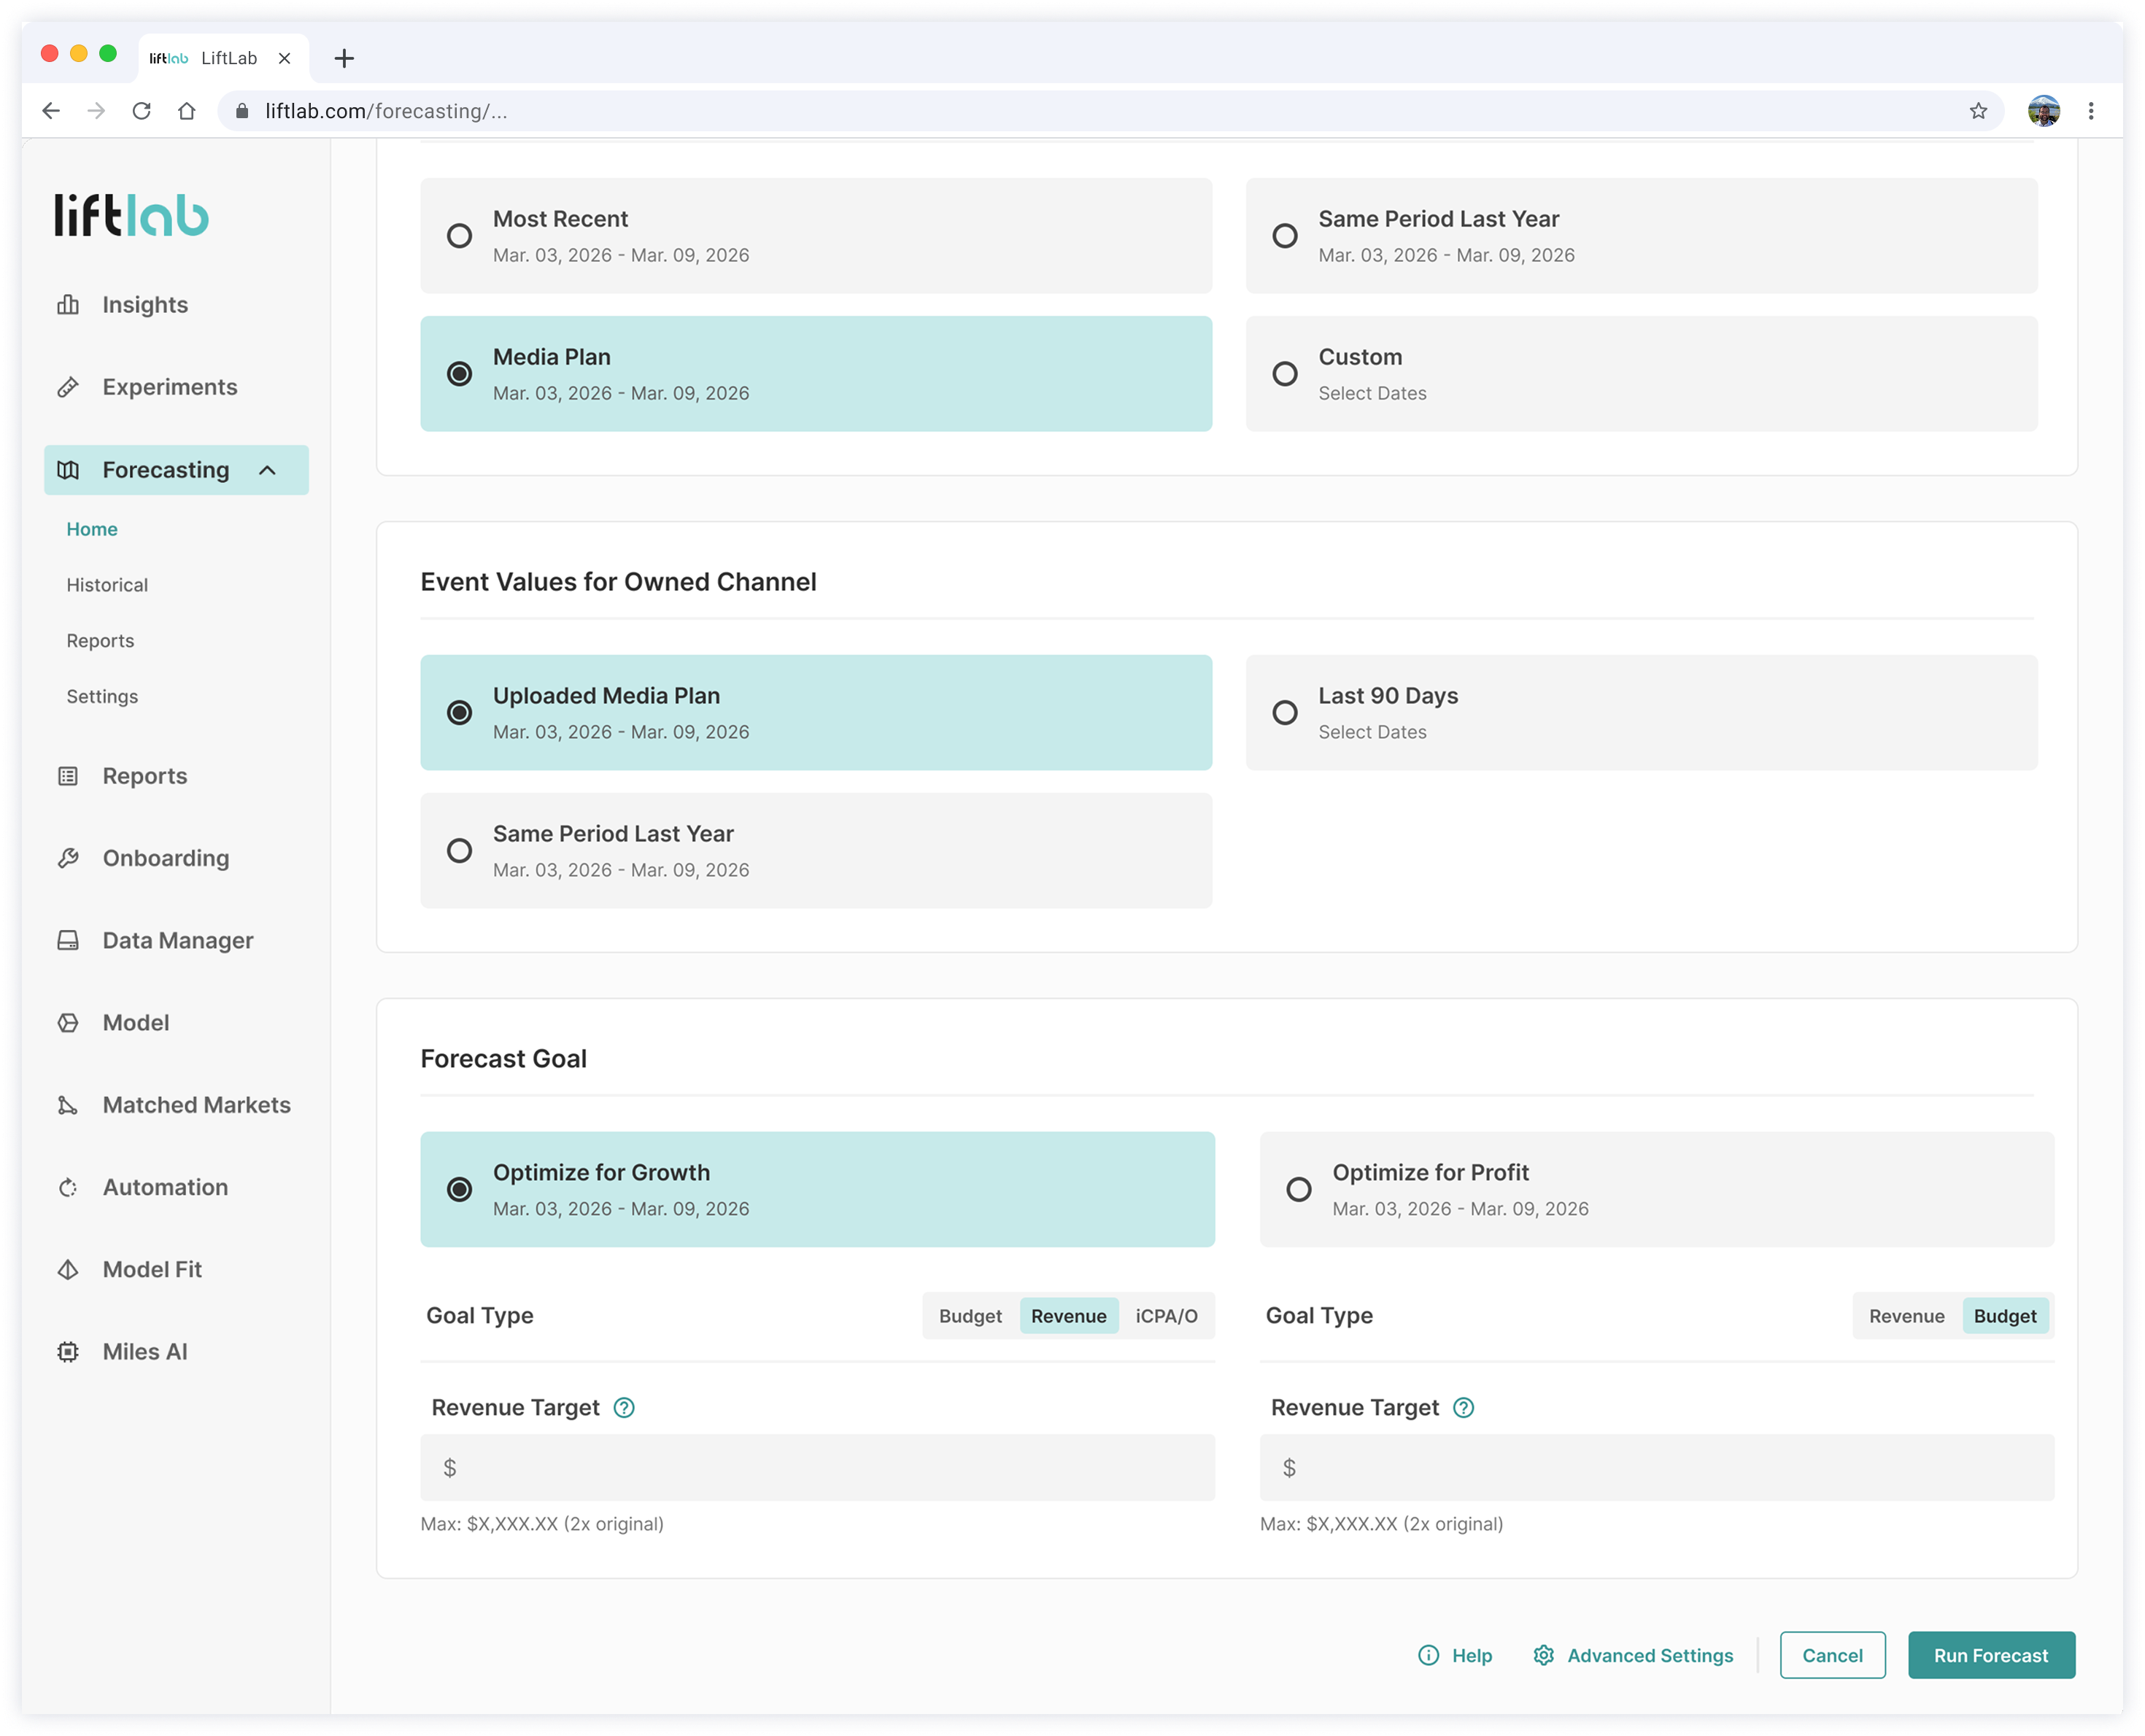
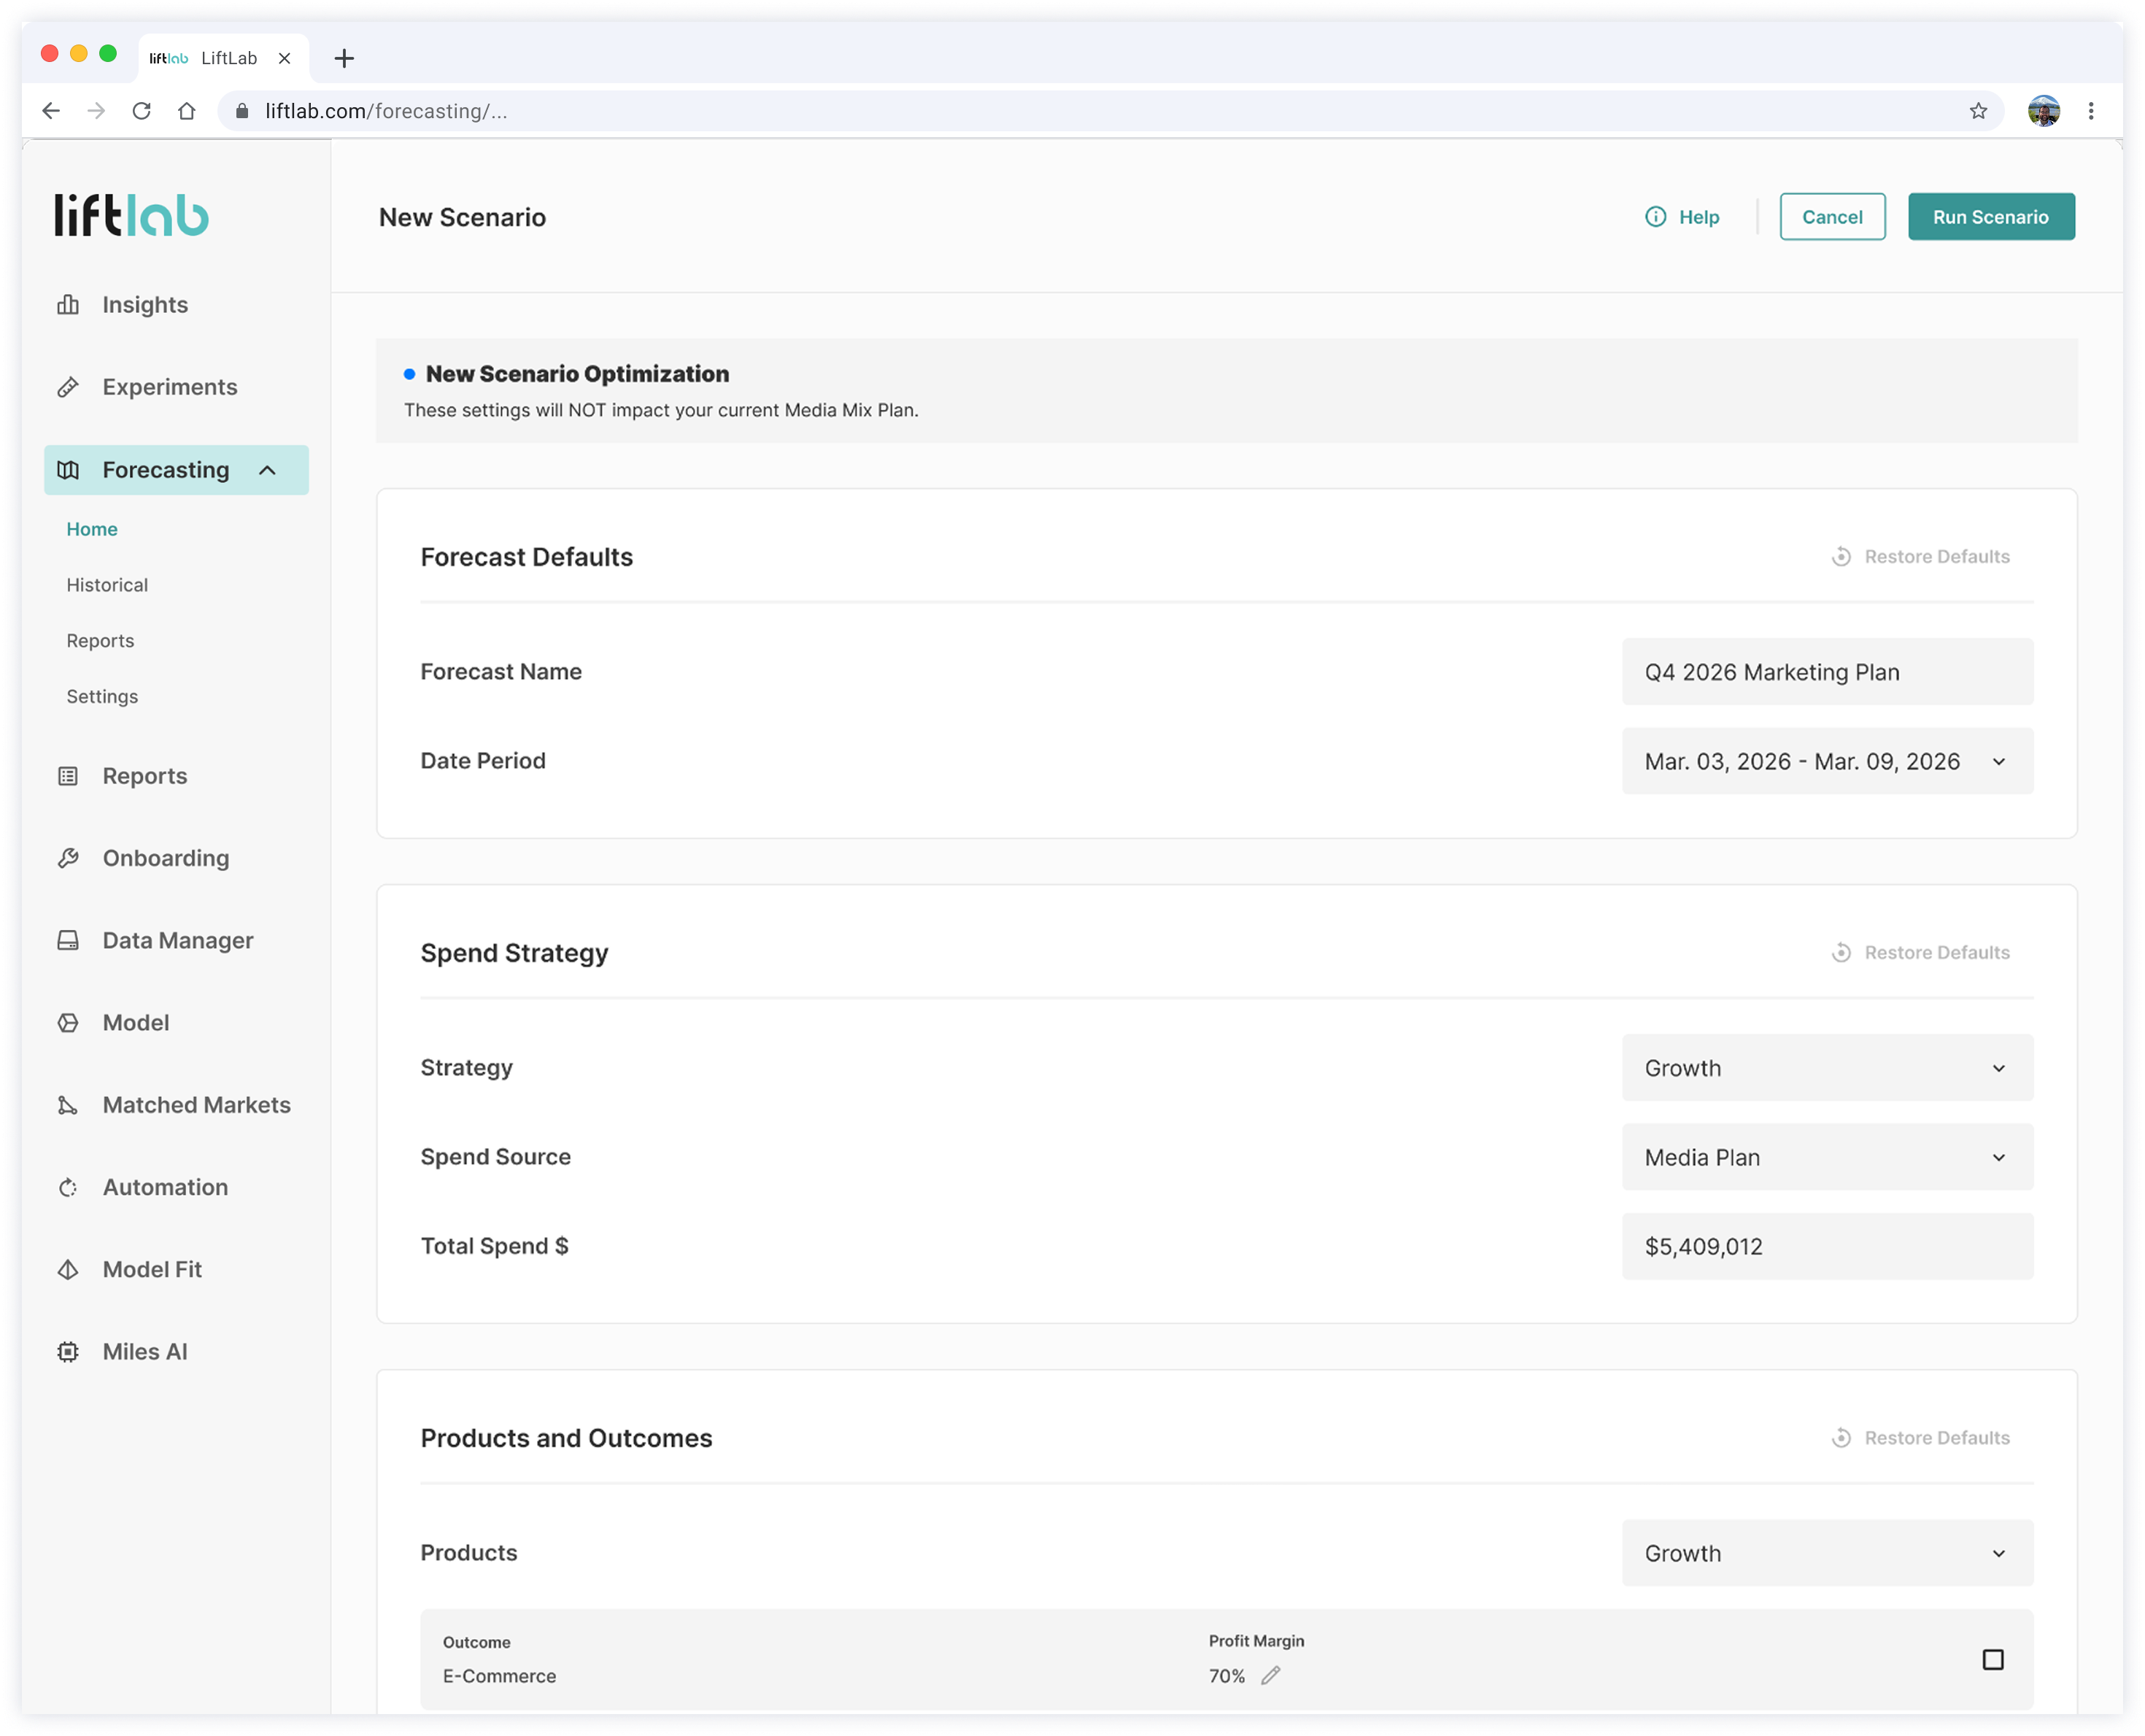
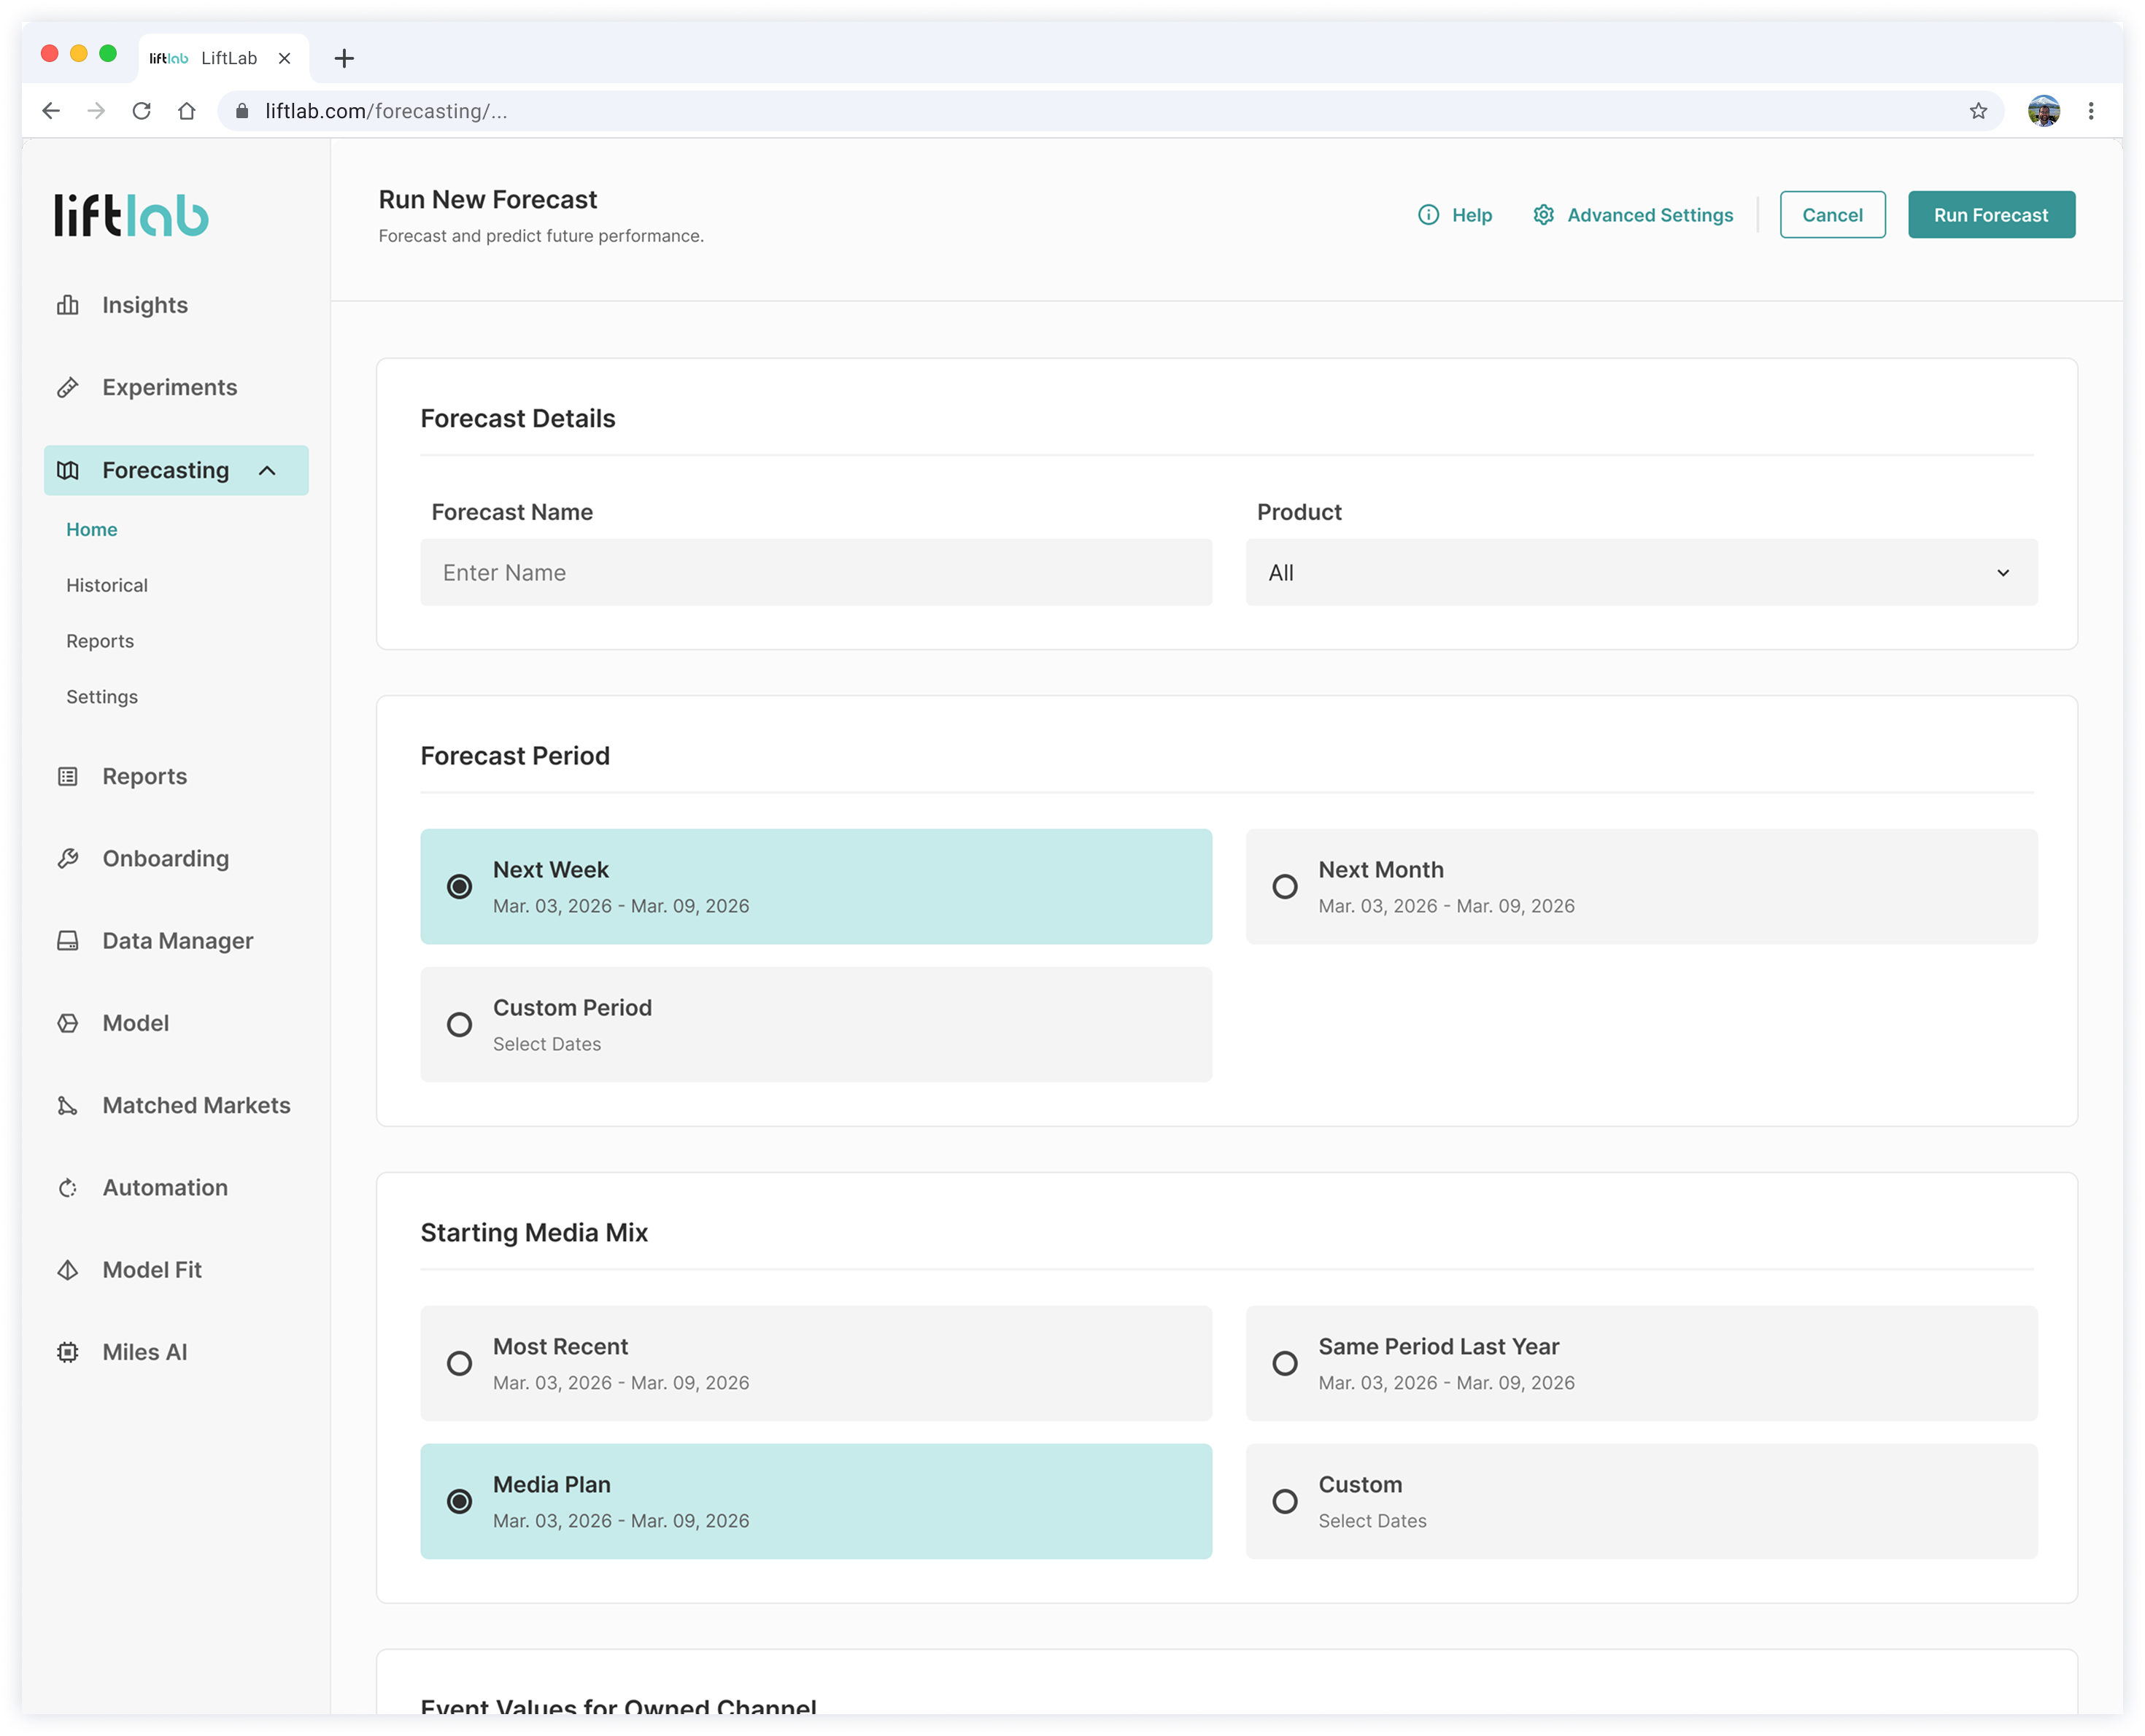
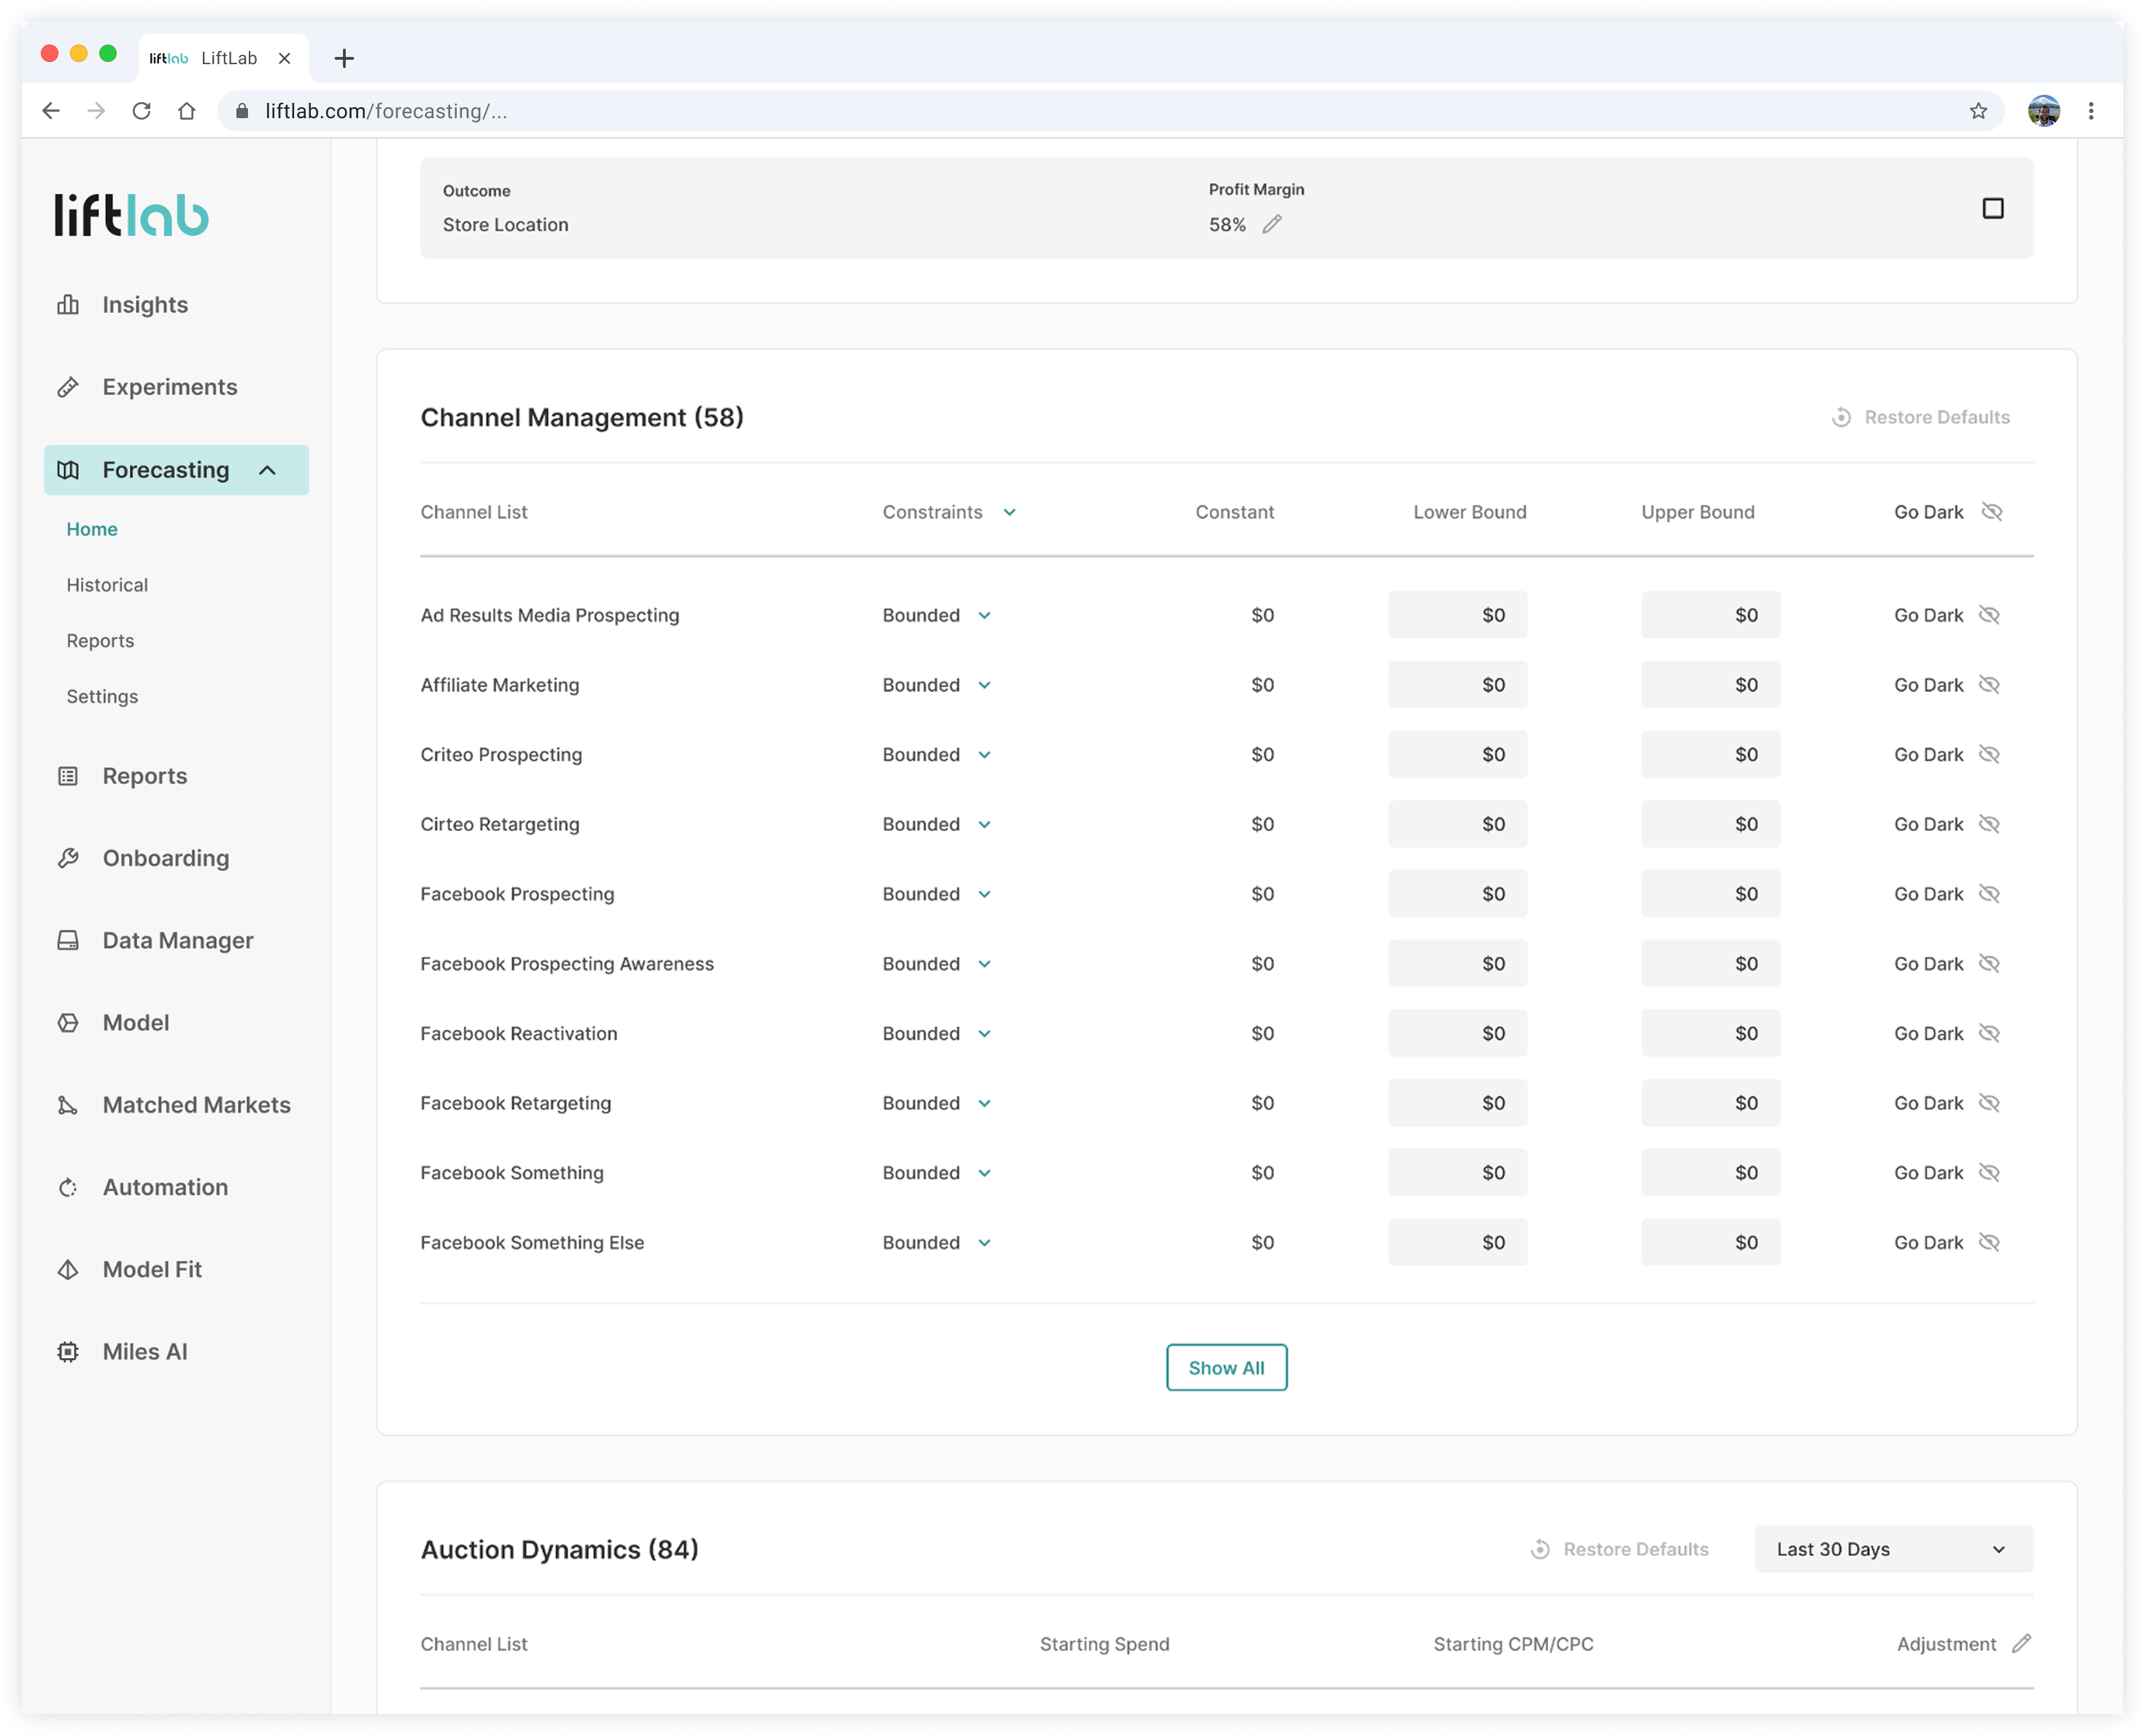
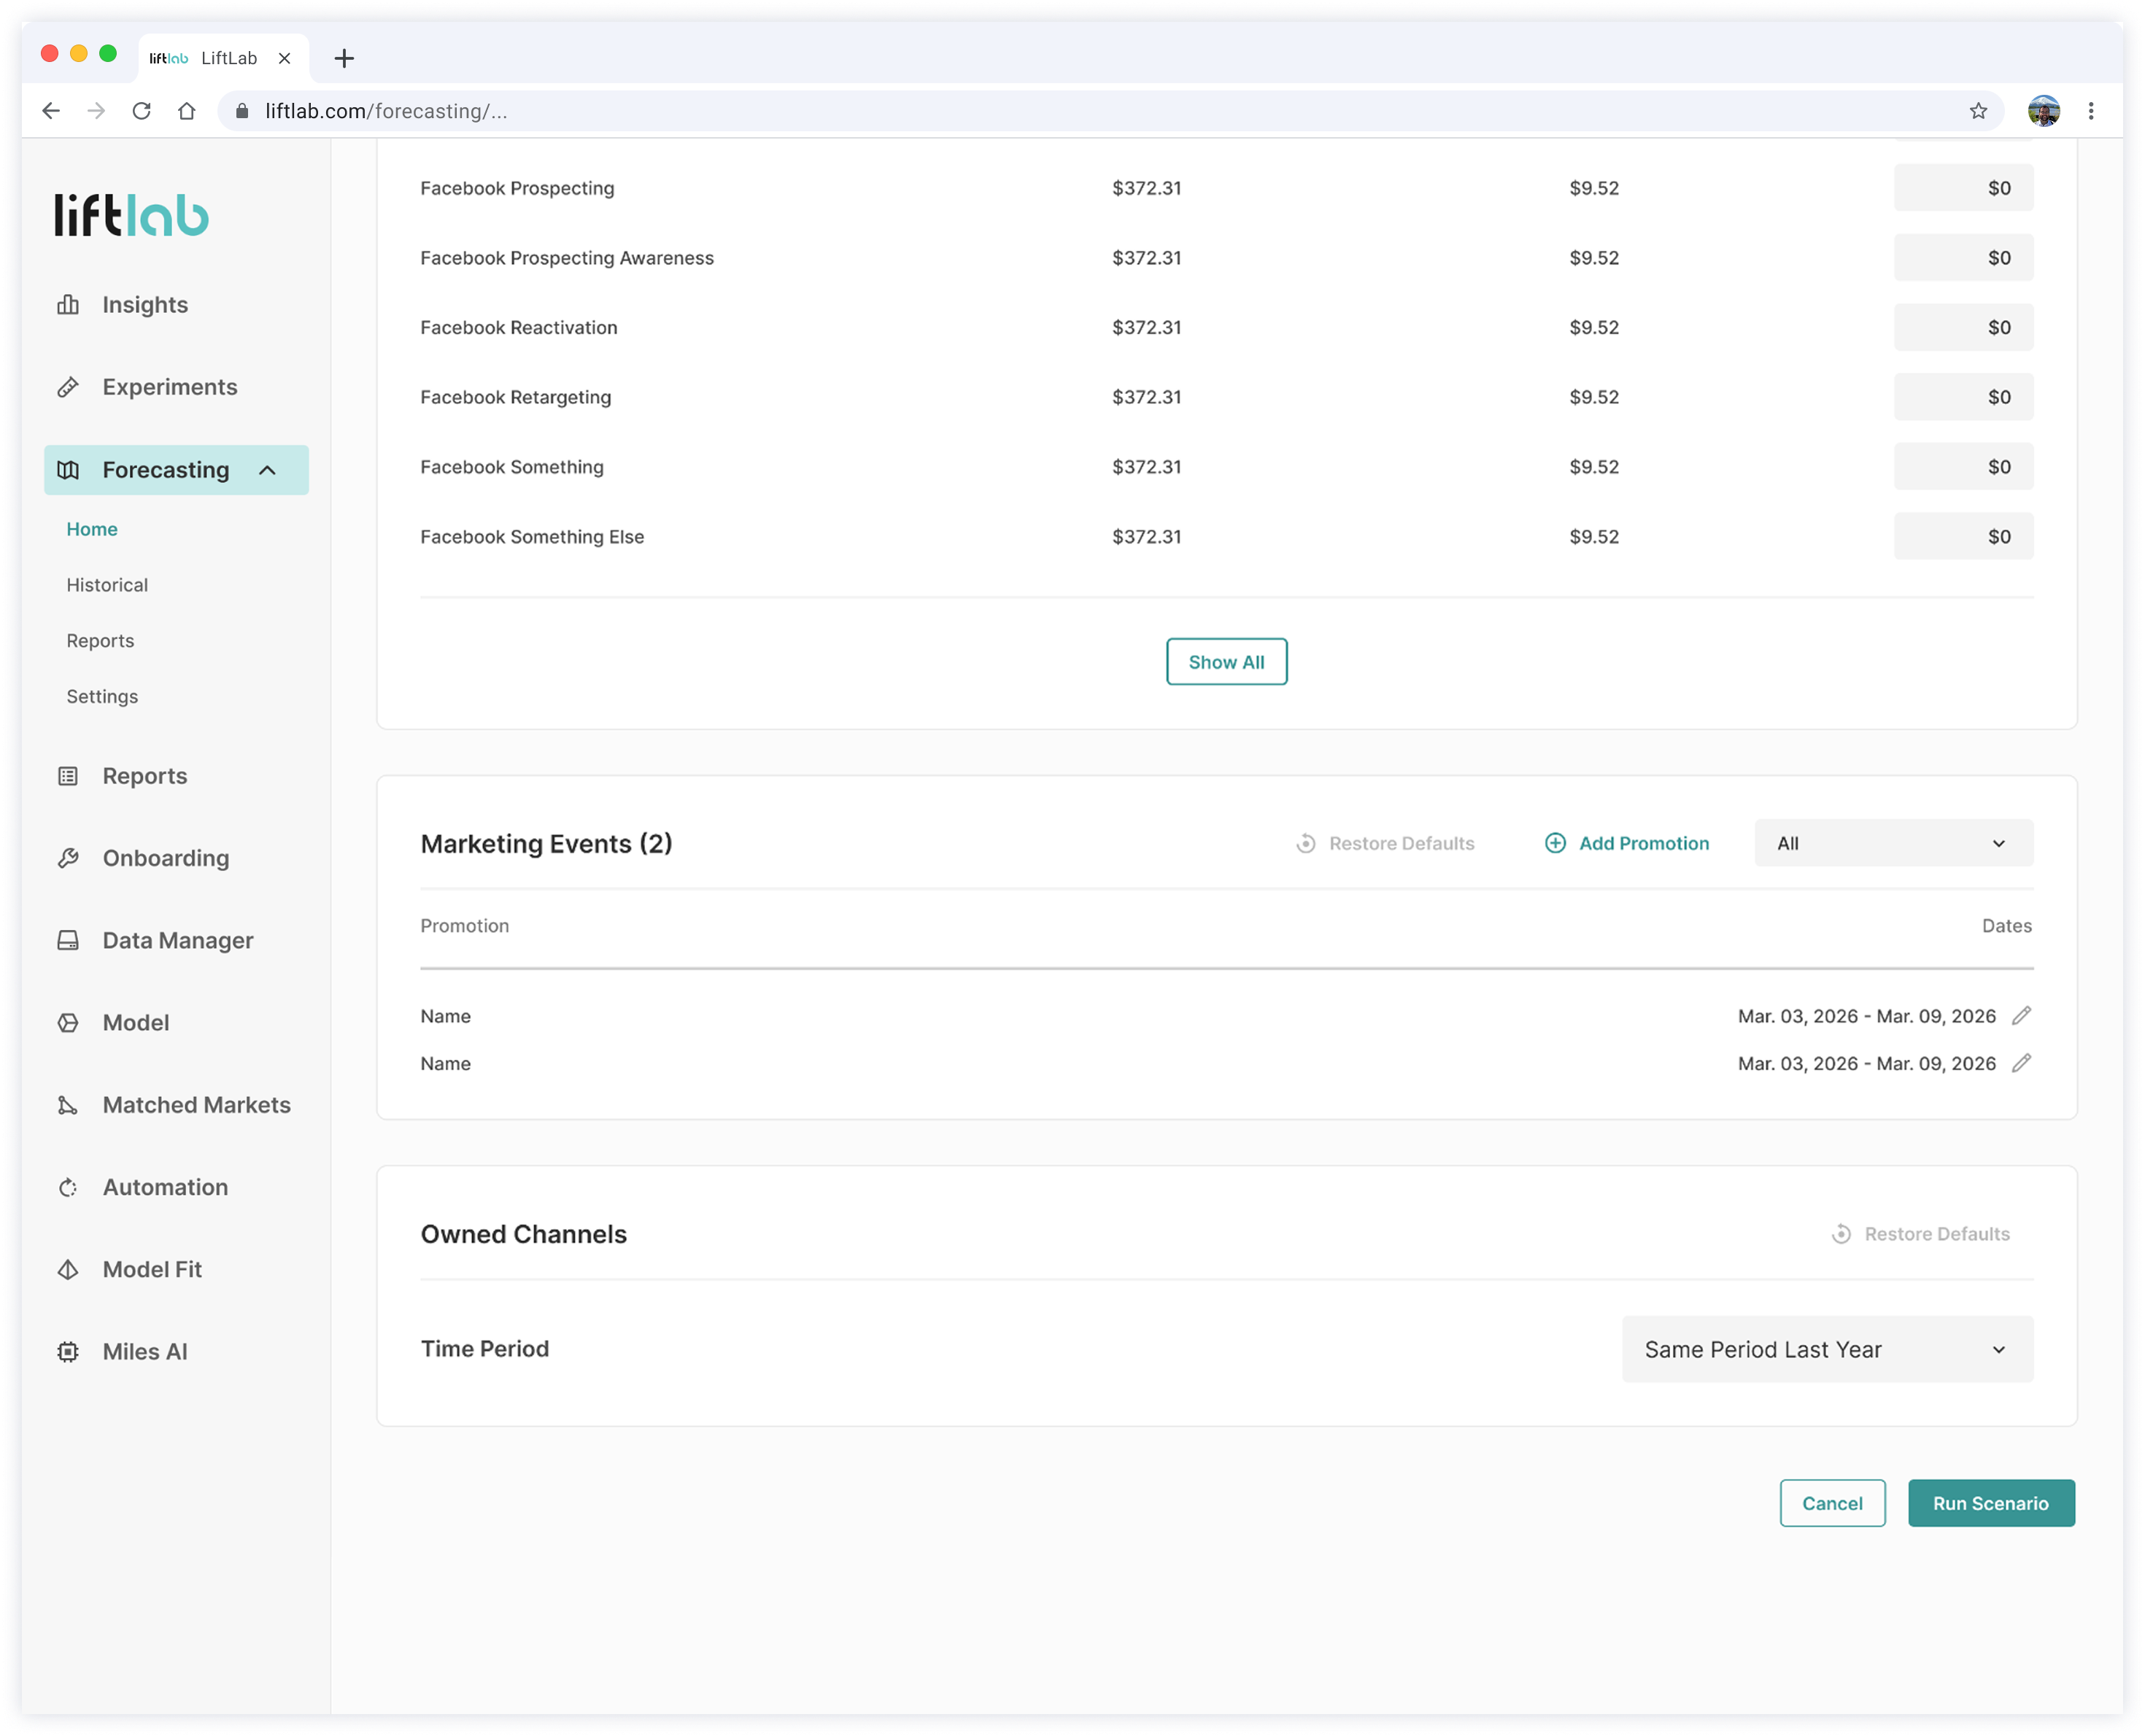
Forecast Settings & Advanced Configuration
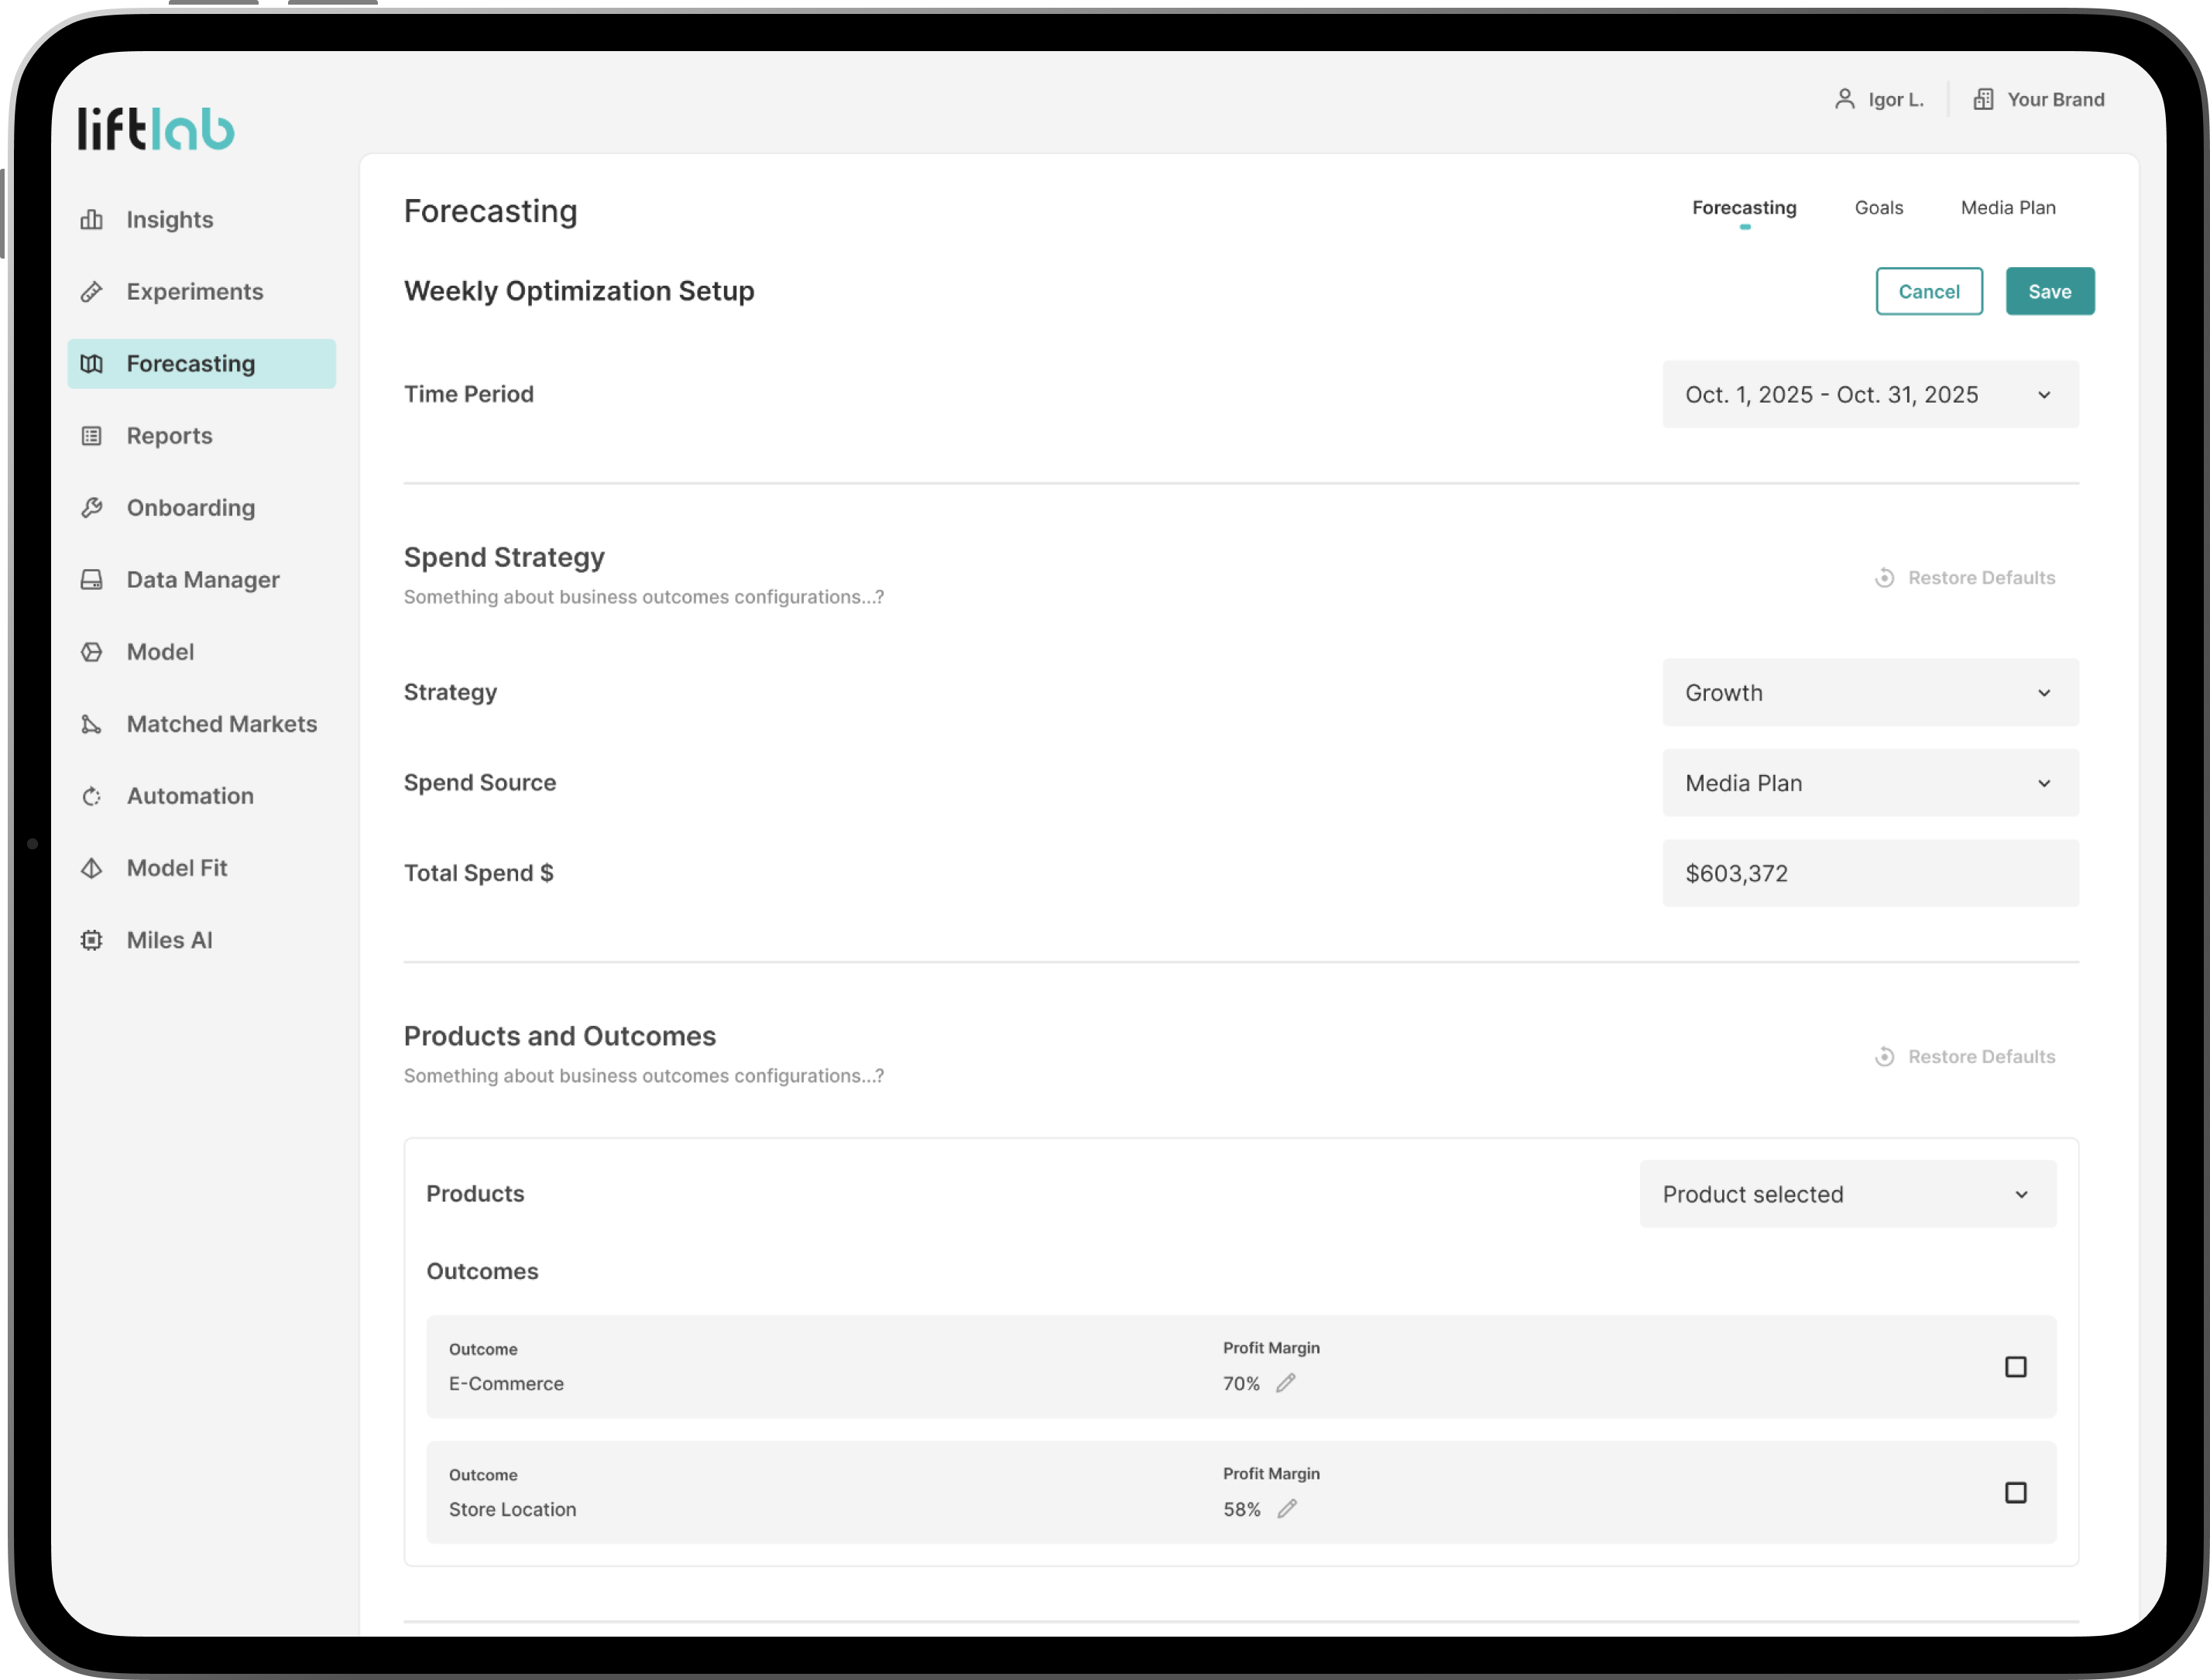
Forecast Creation Default Settings
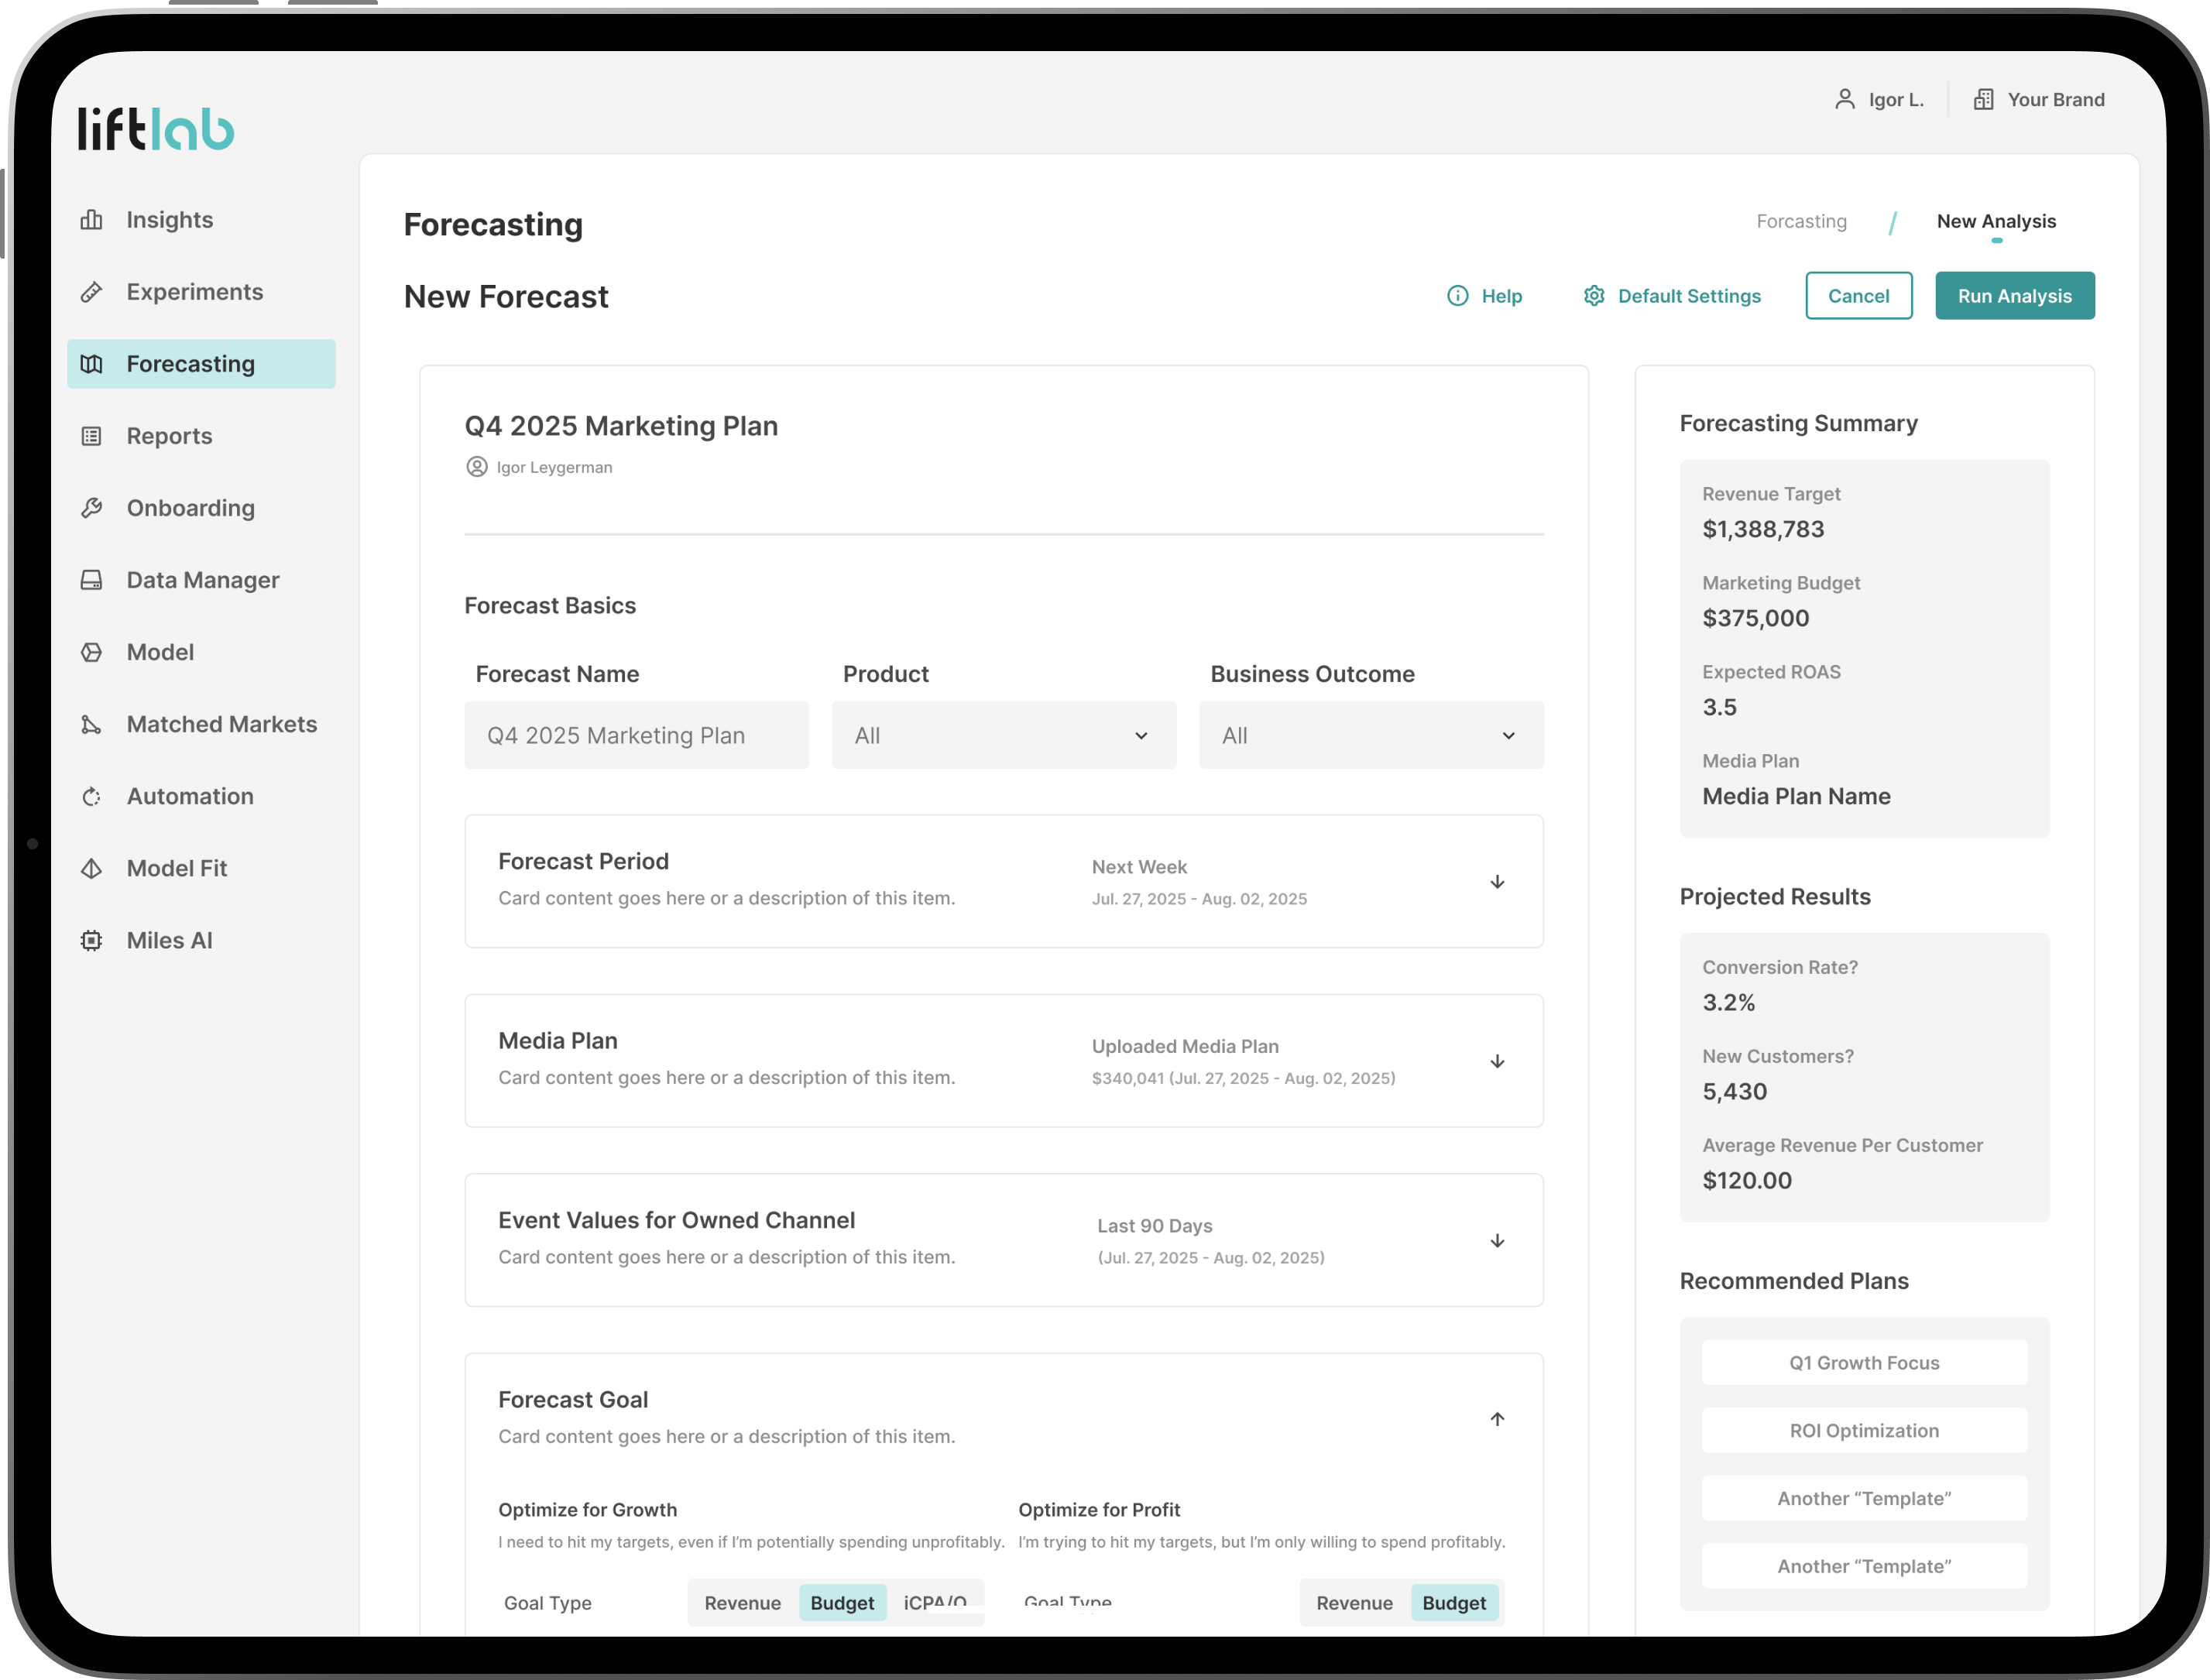
Create Forecast Default Settings
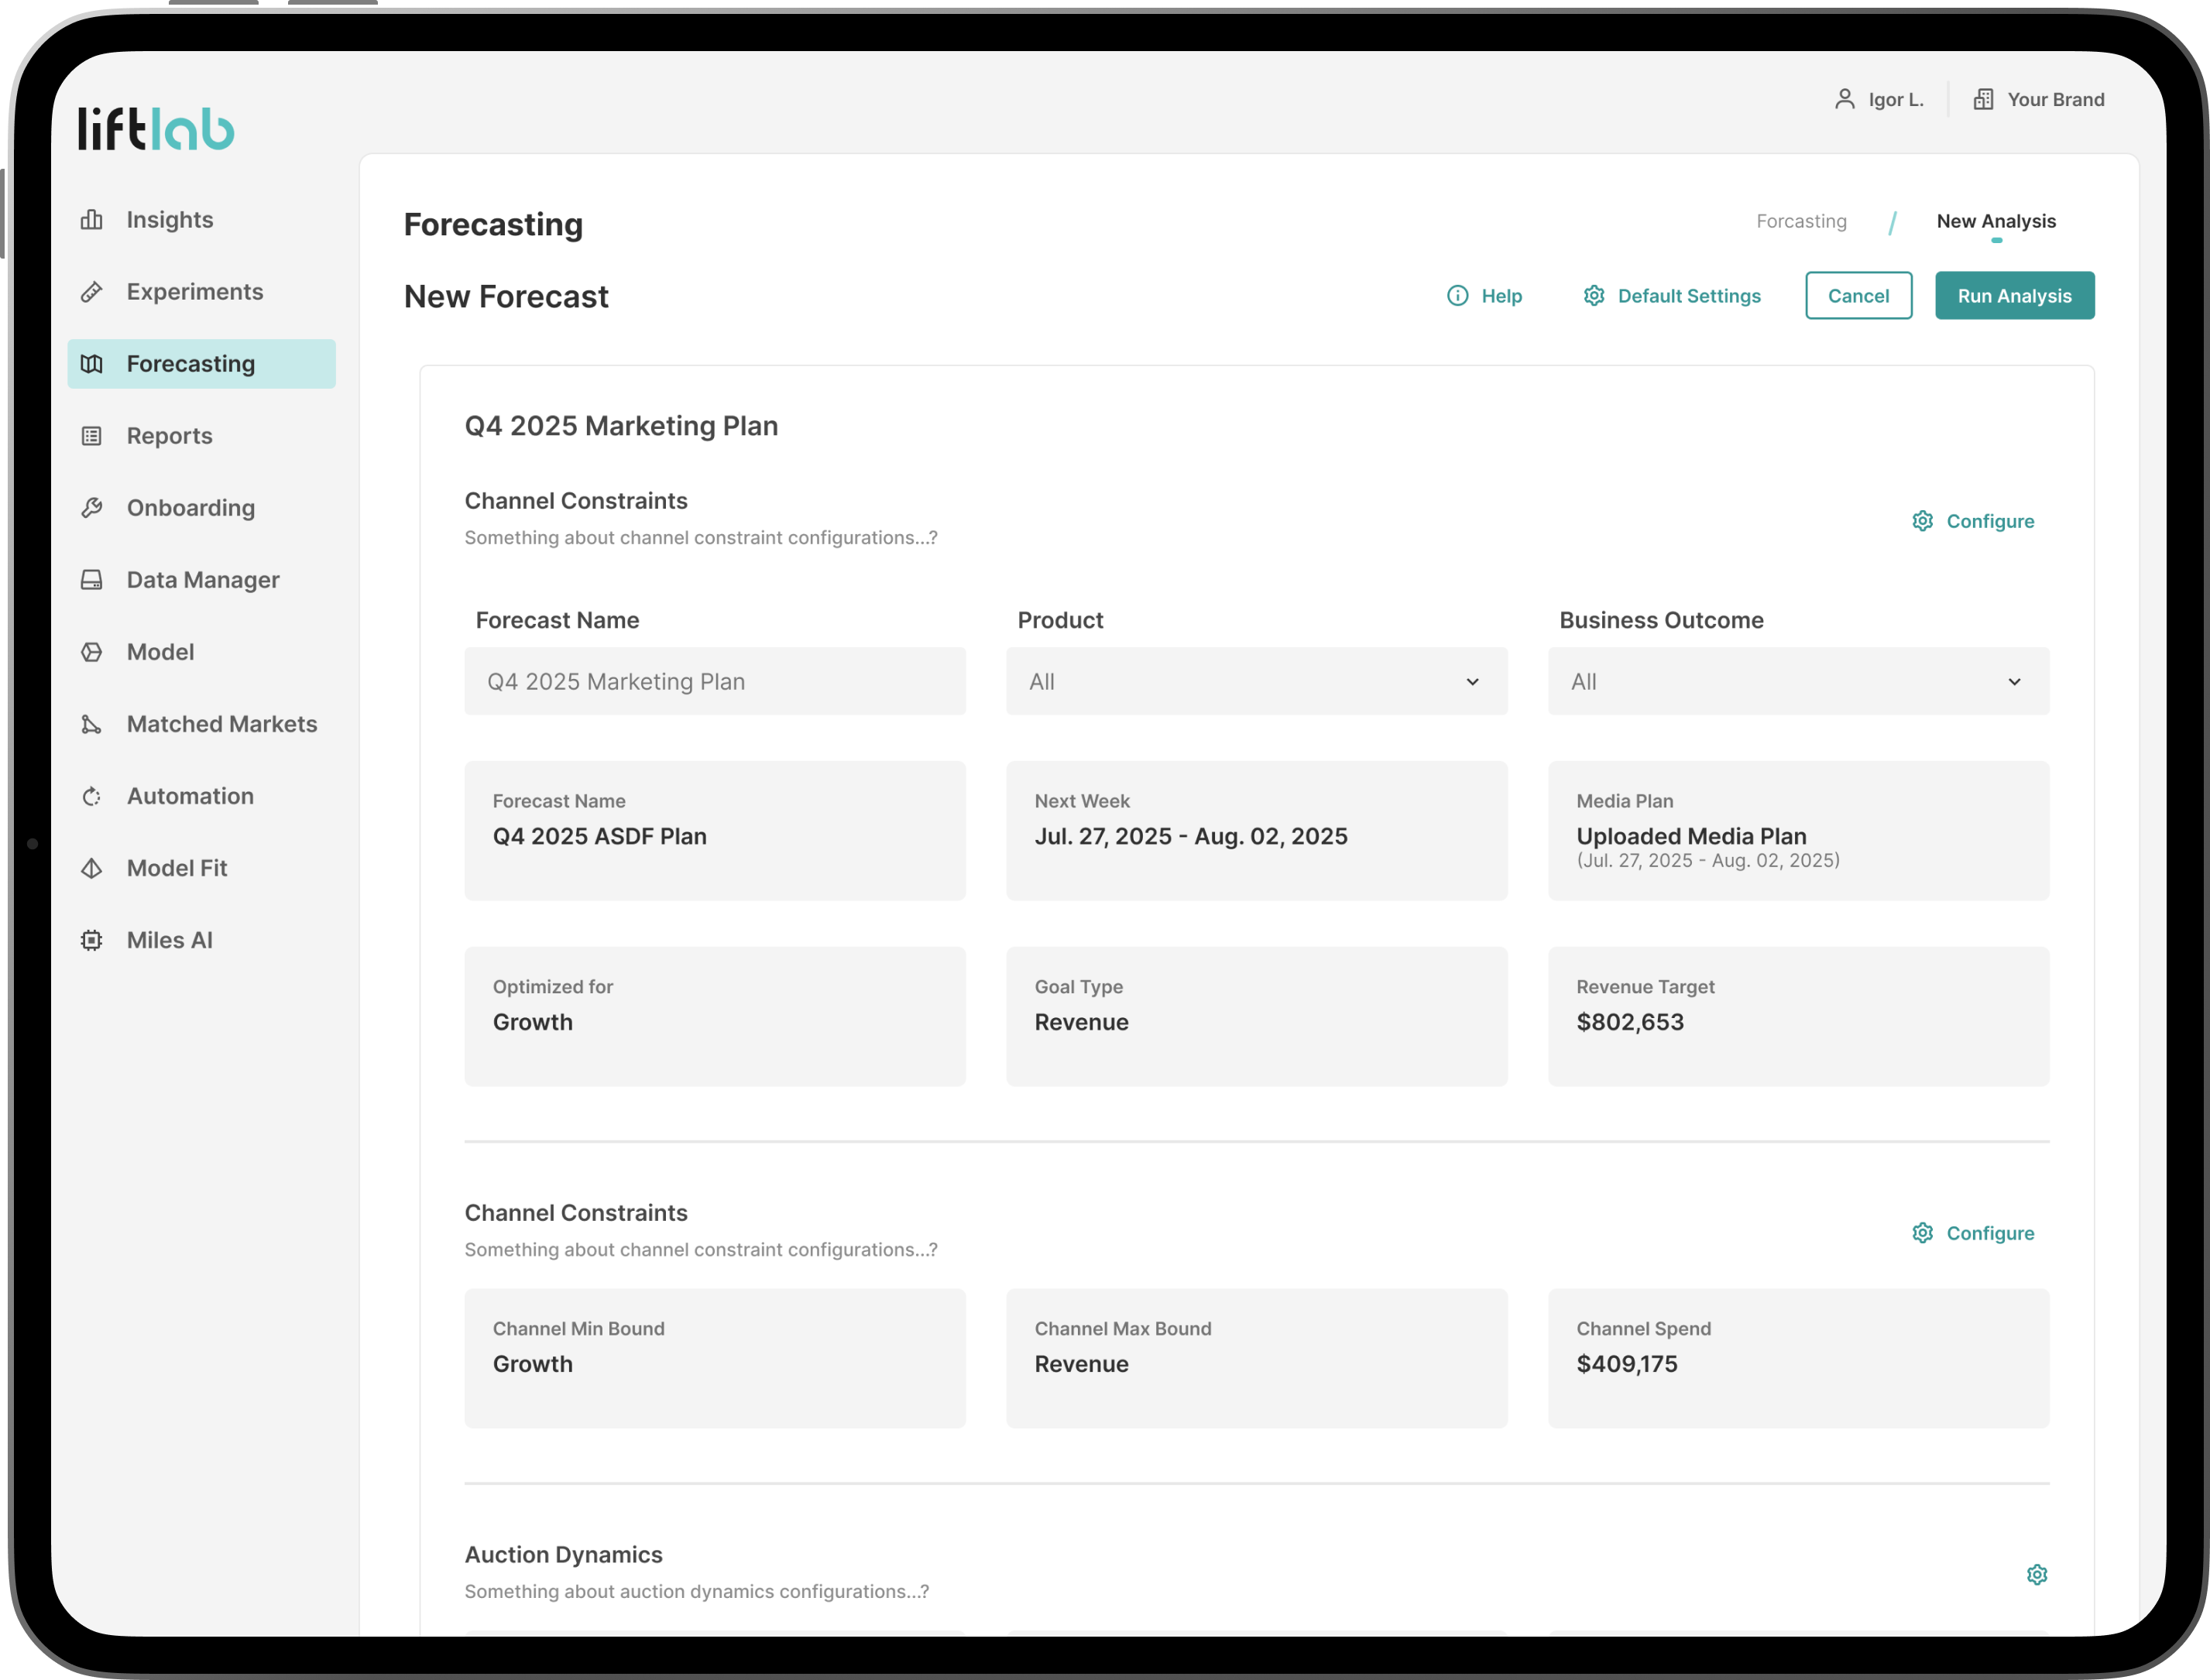
Forecast Settings Updated Views
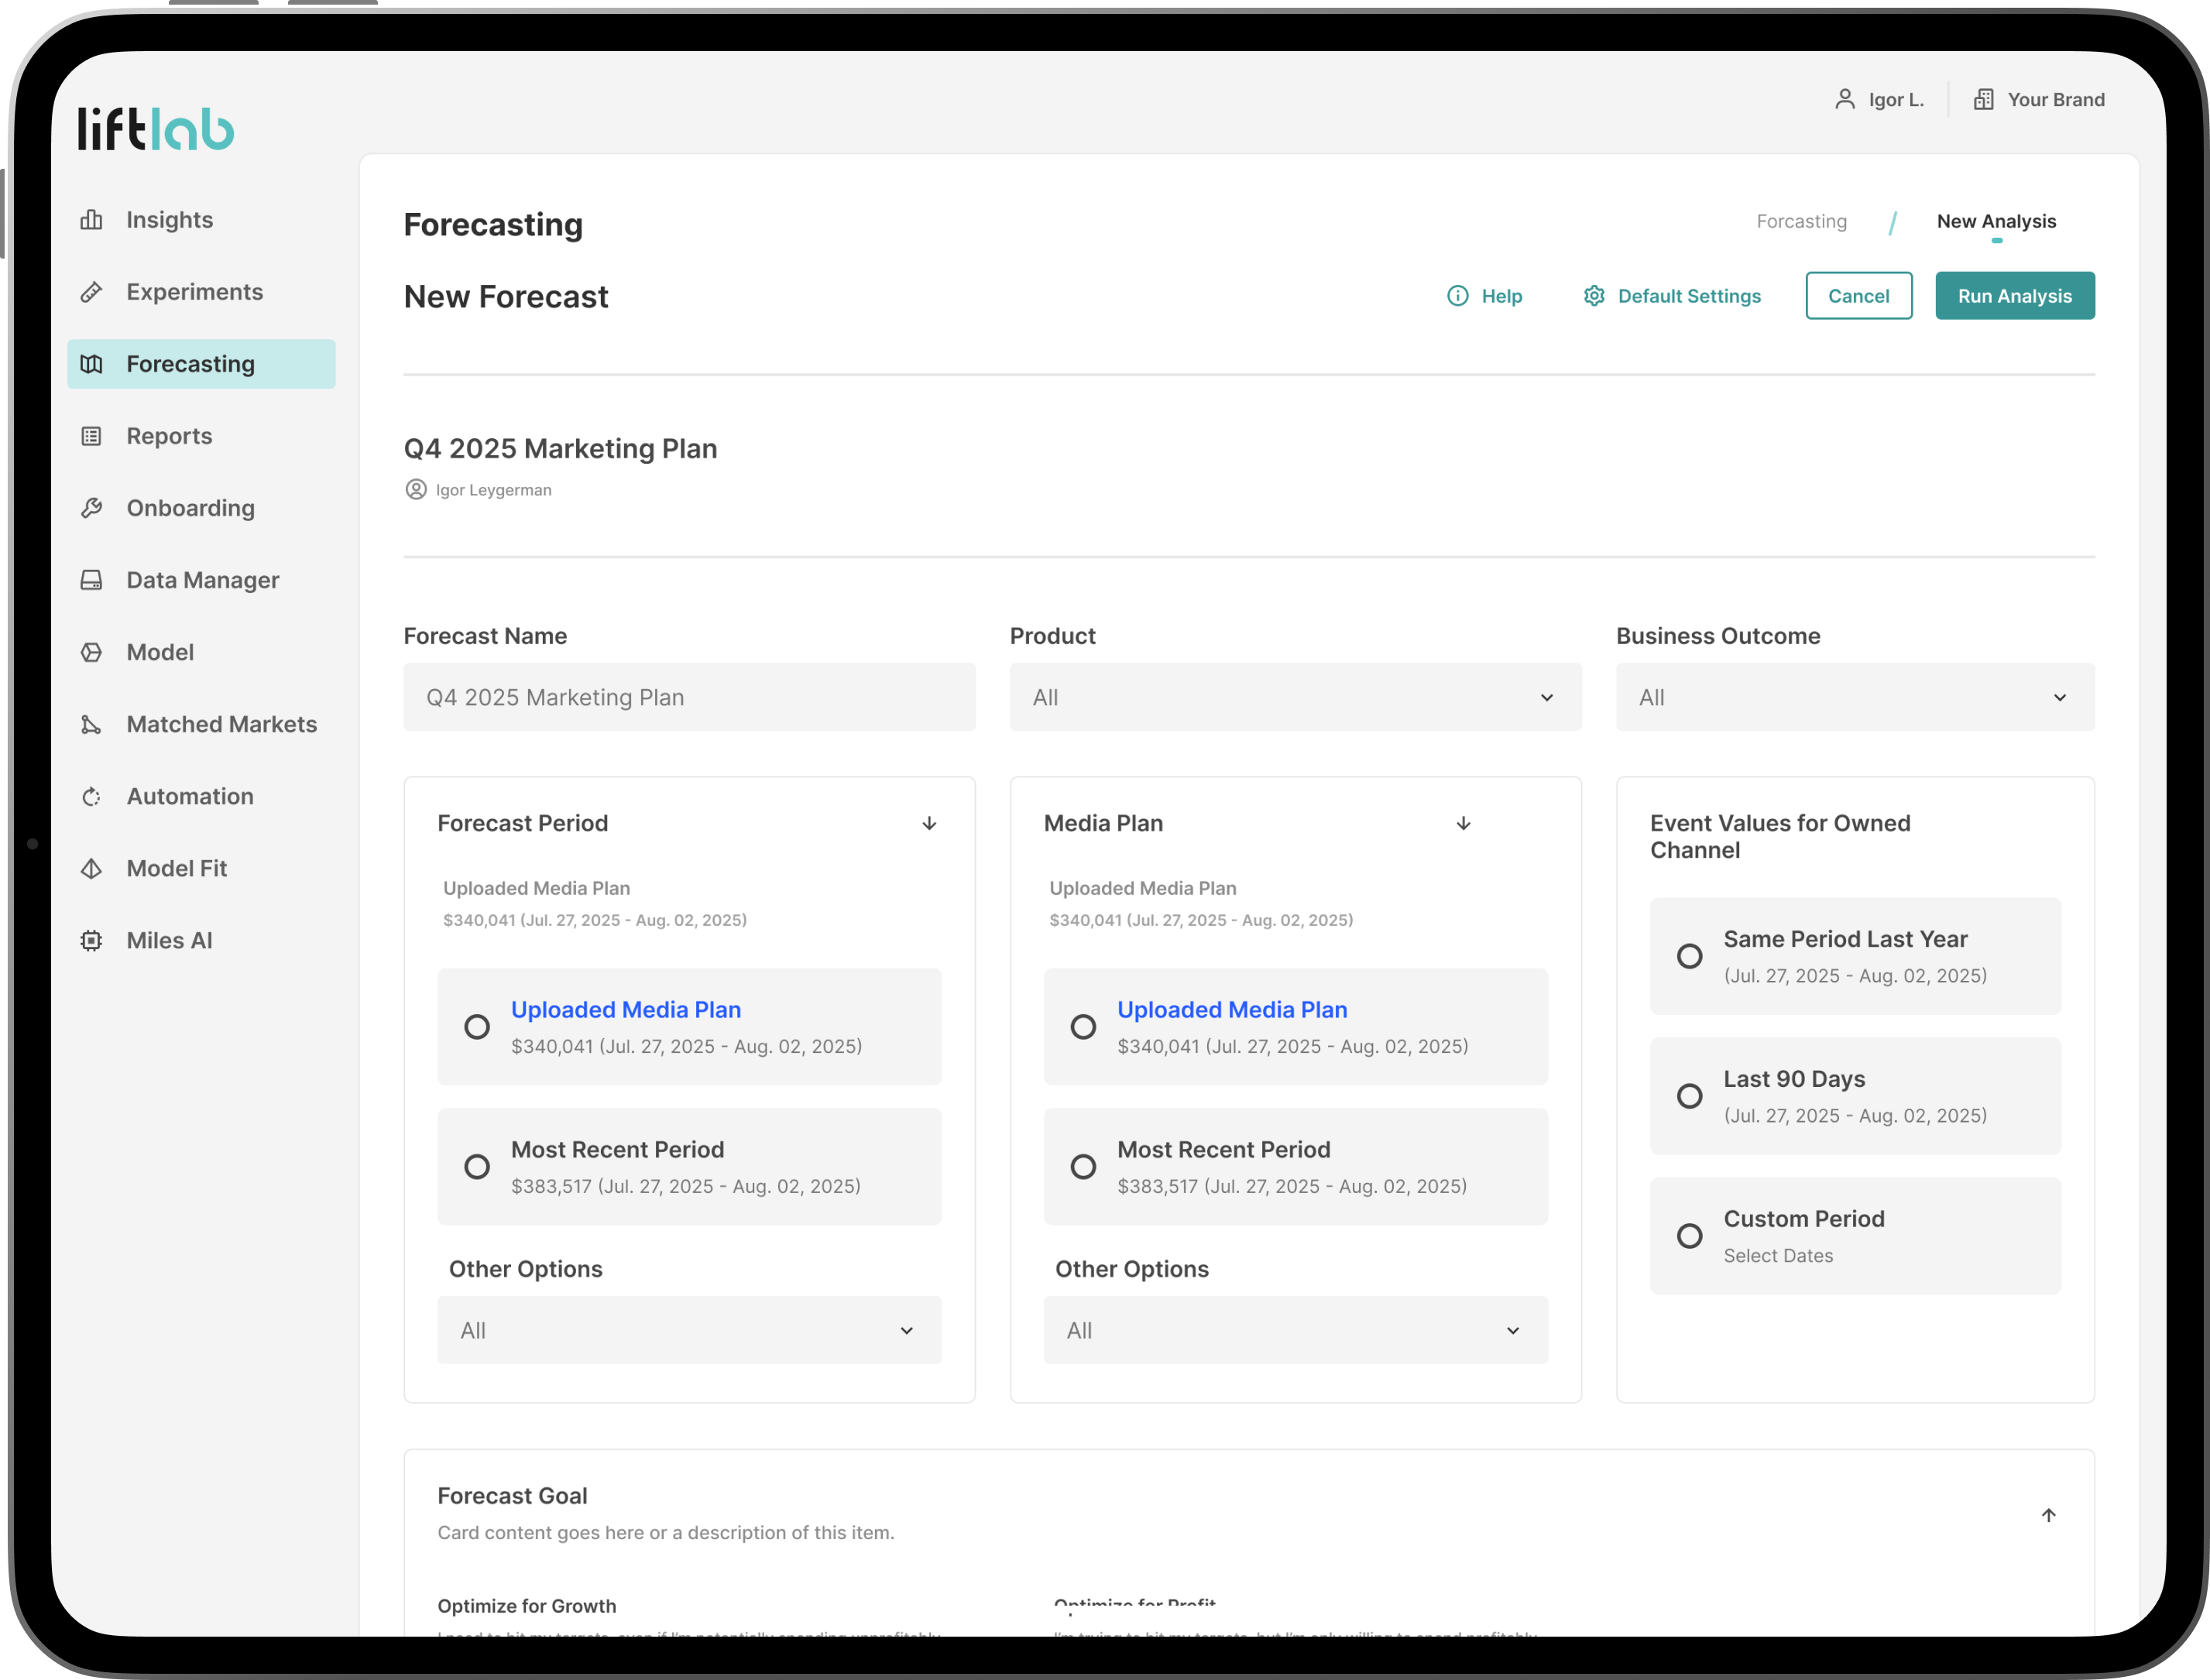
Default Settings Config A
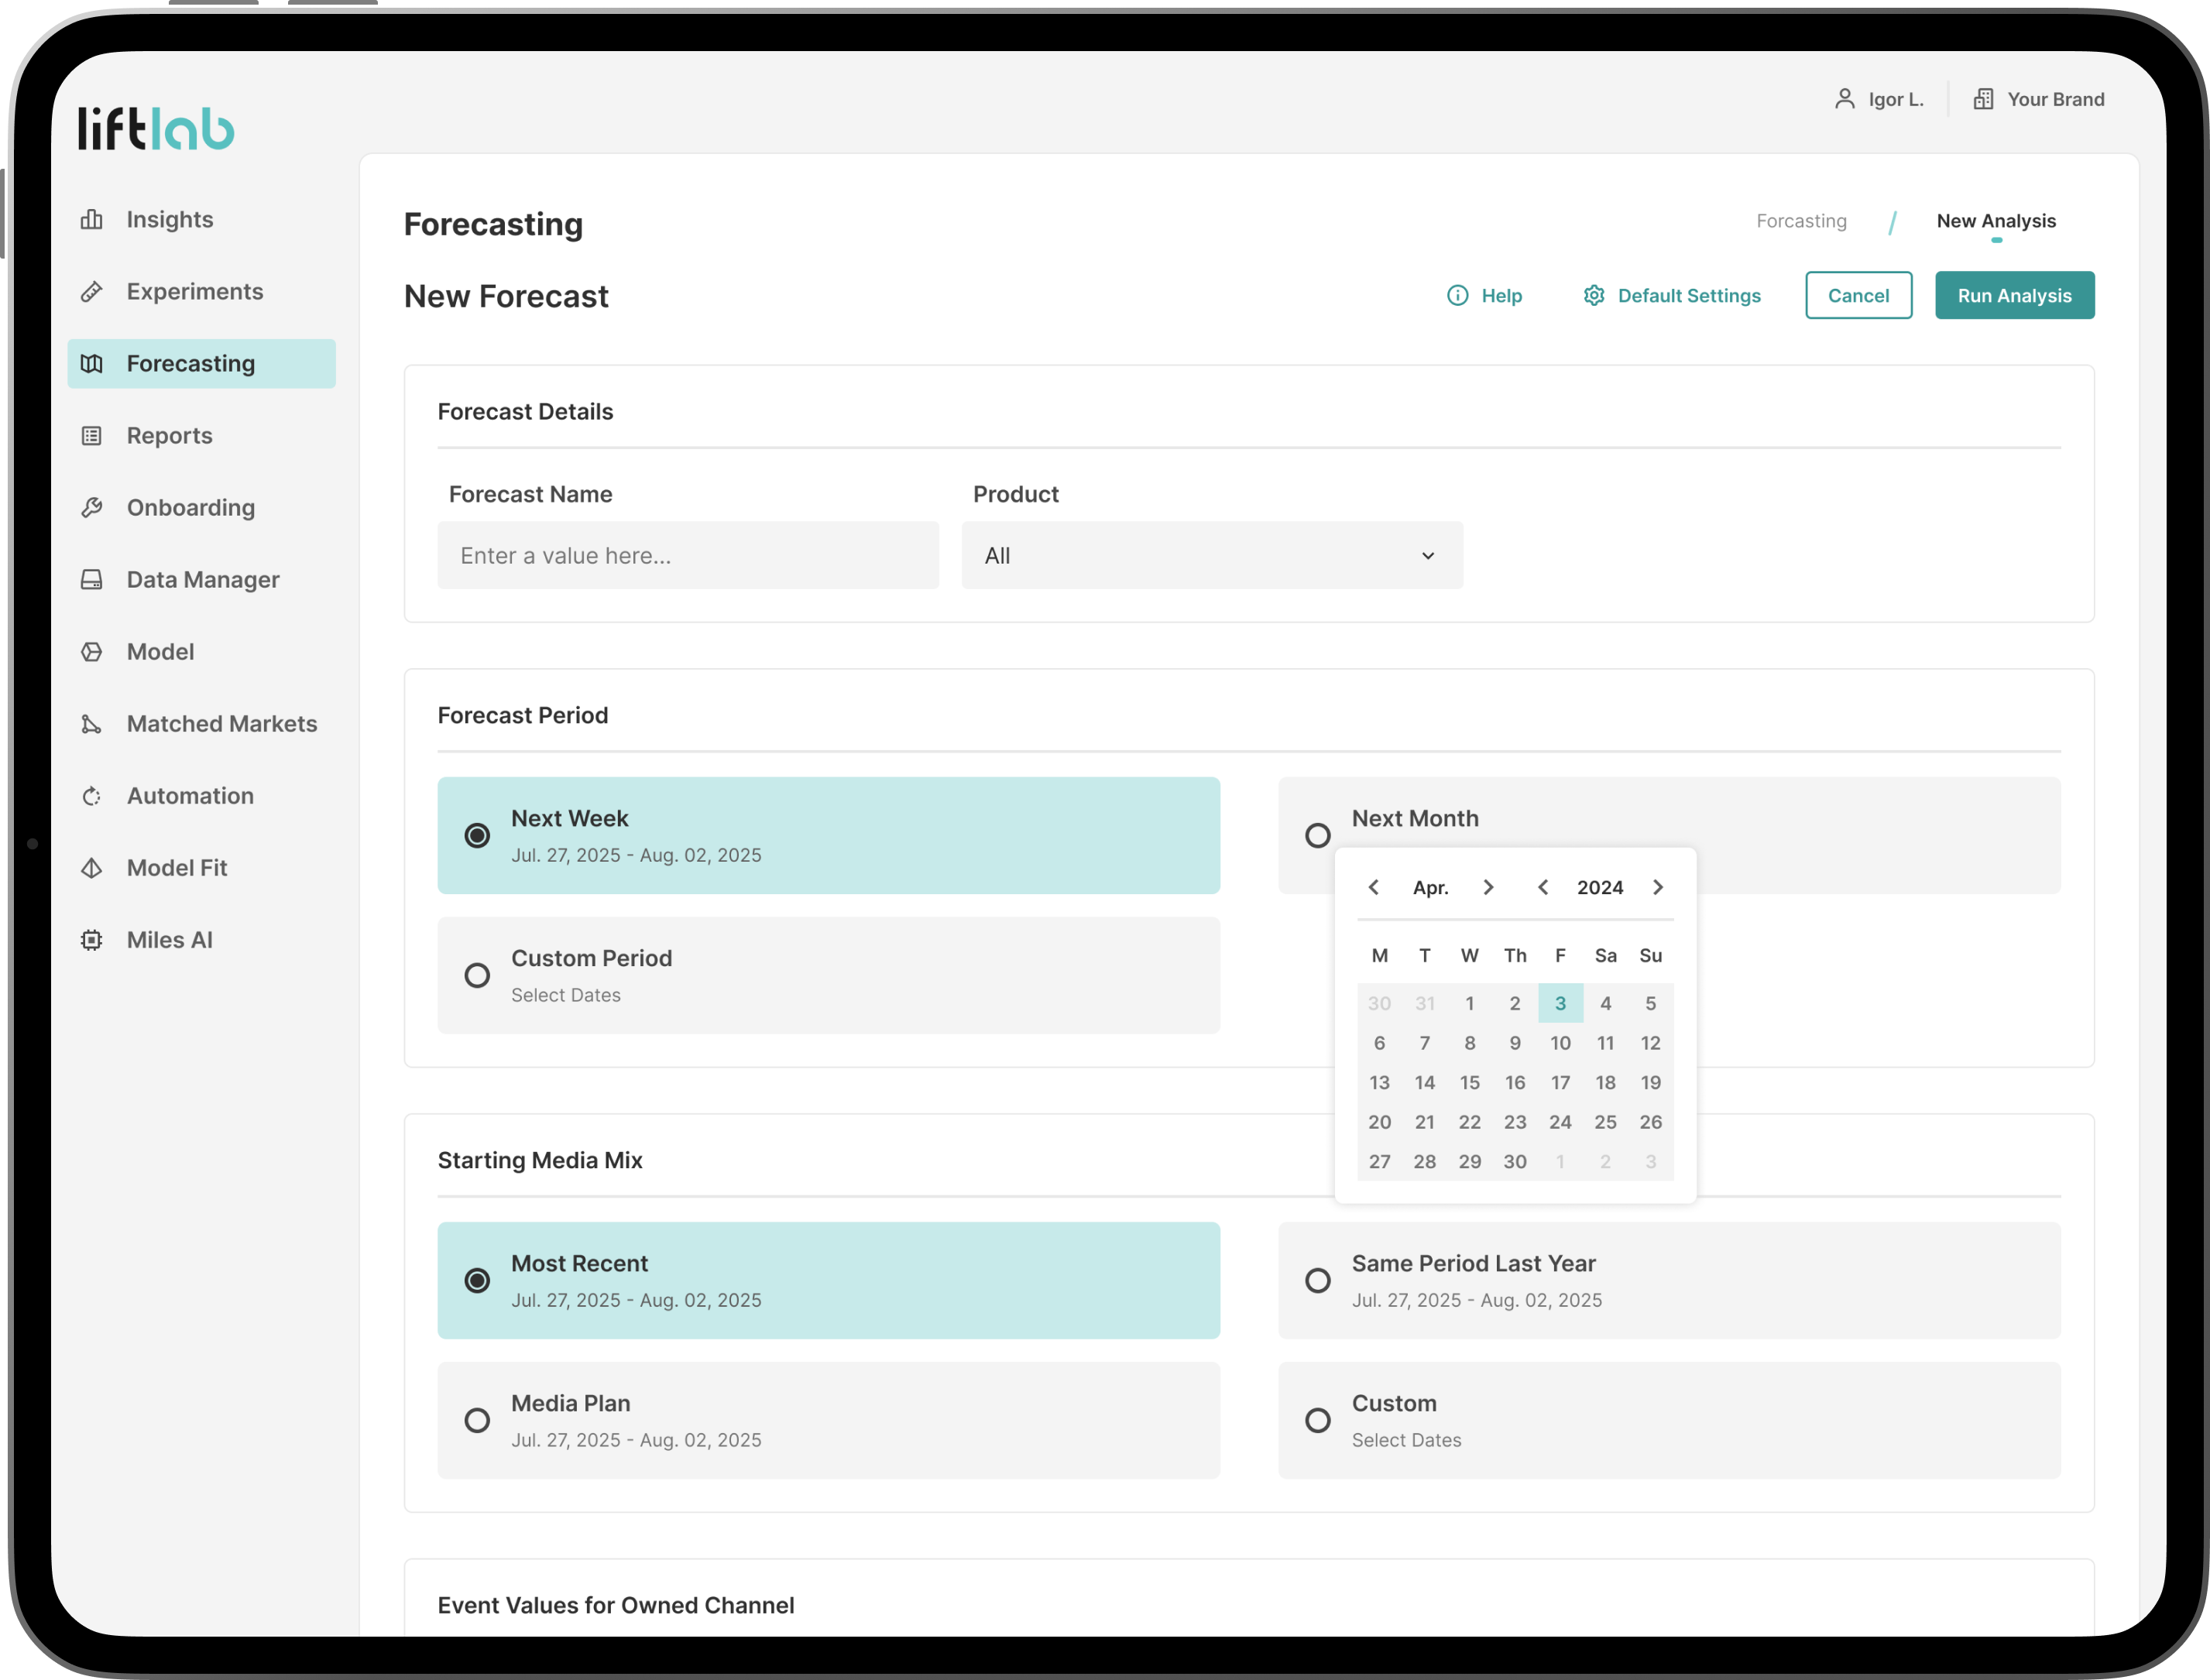
Default Settings Date Picker
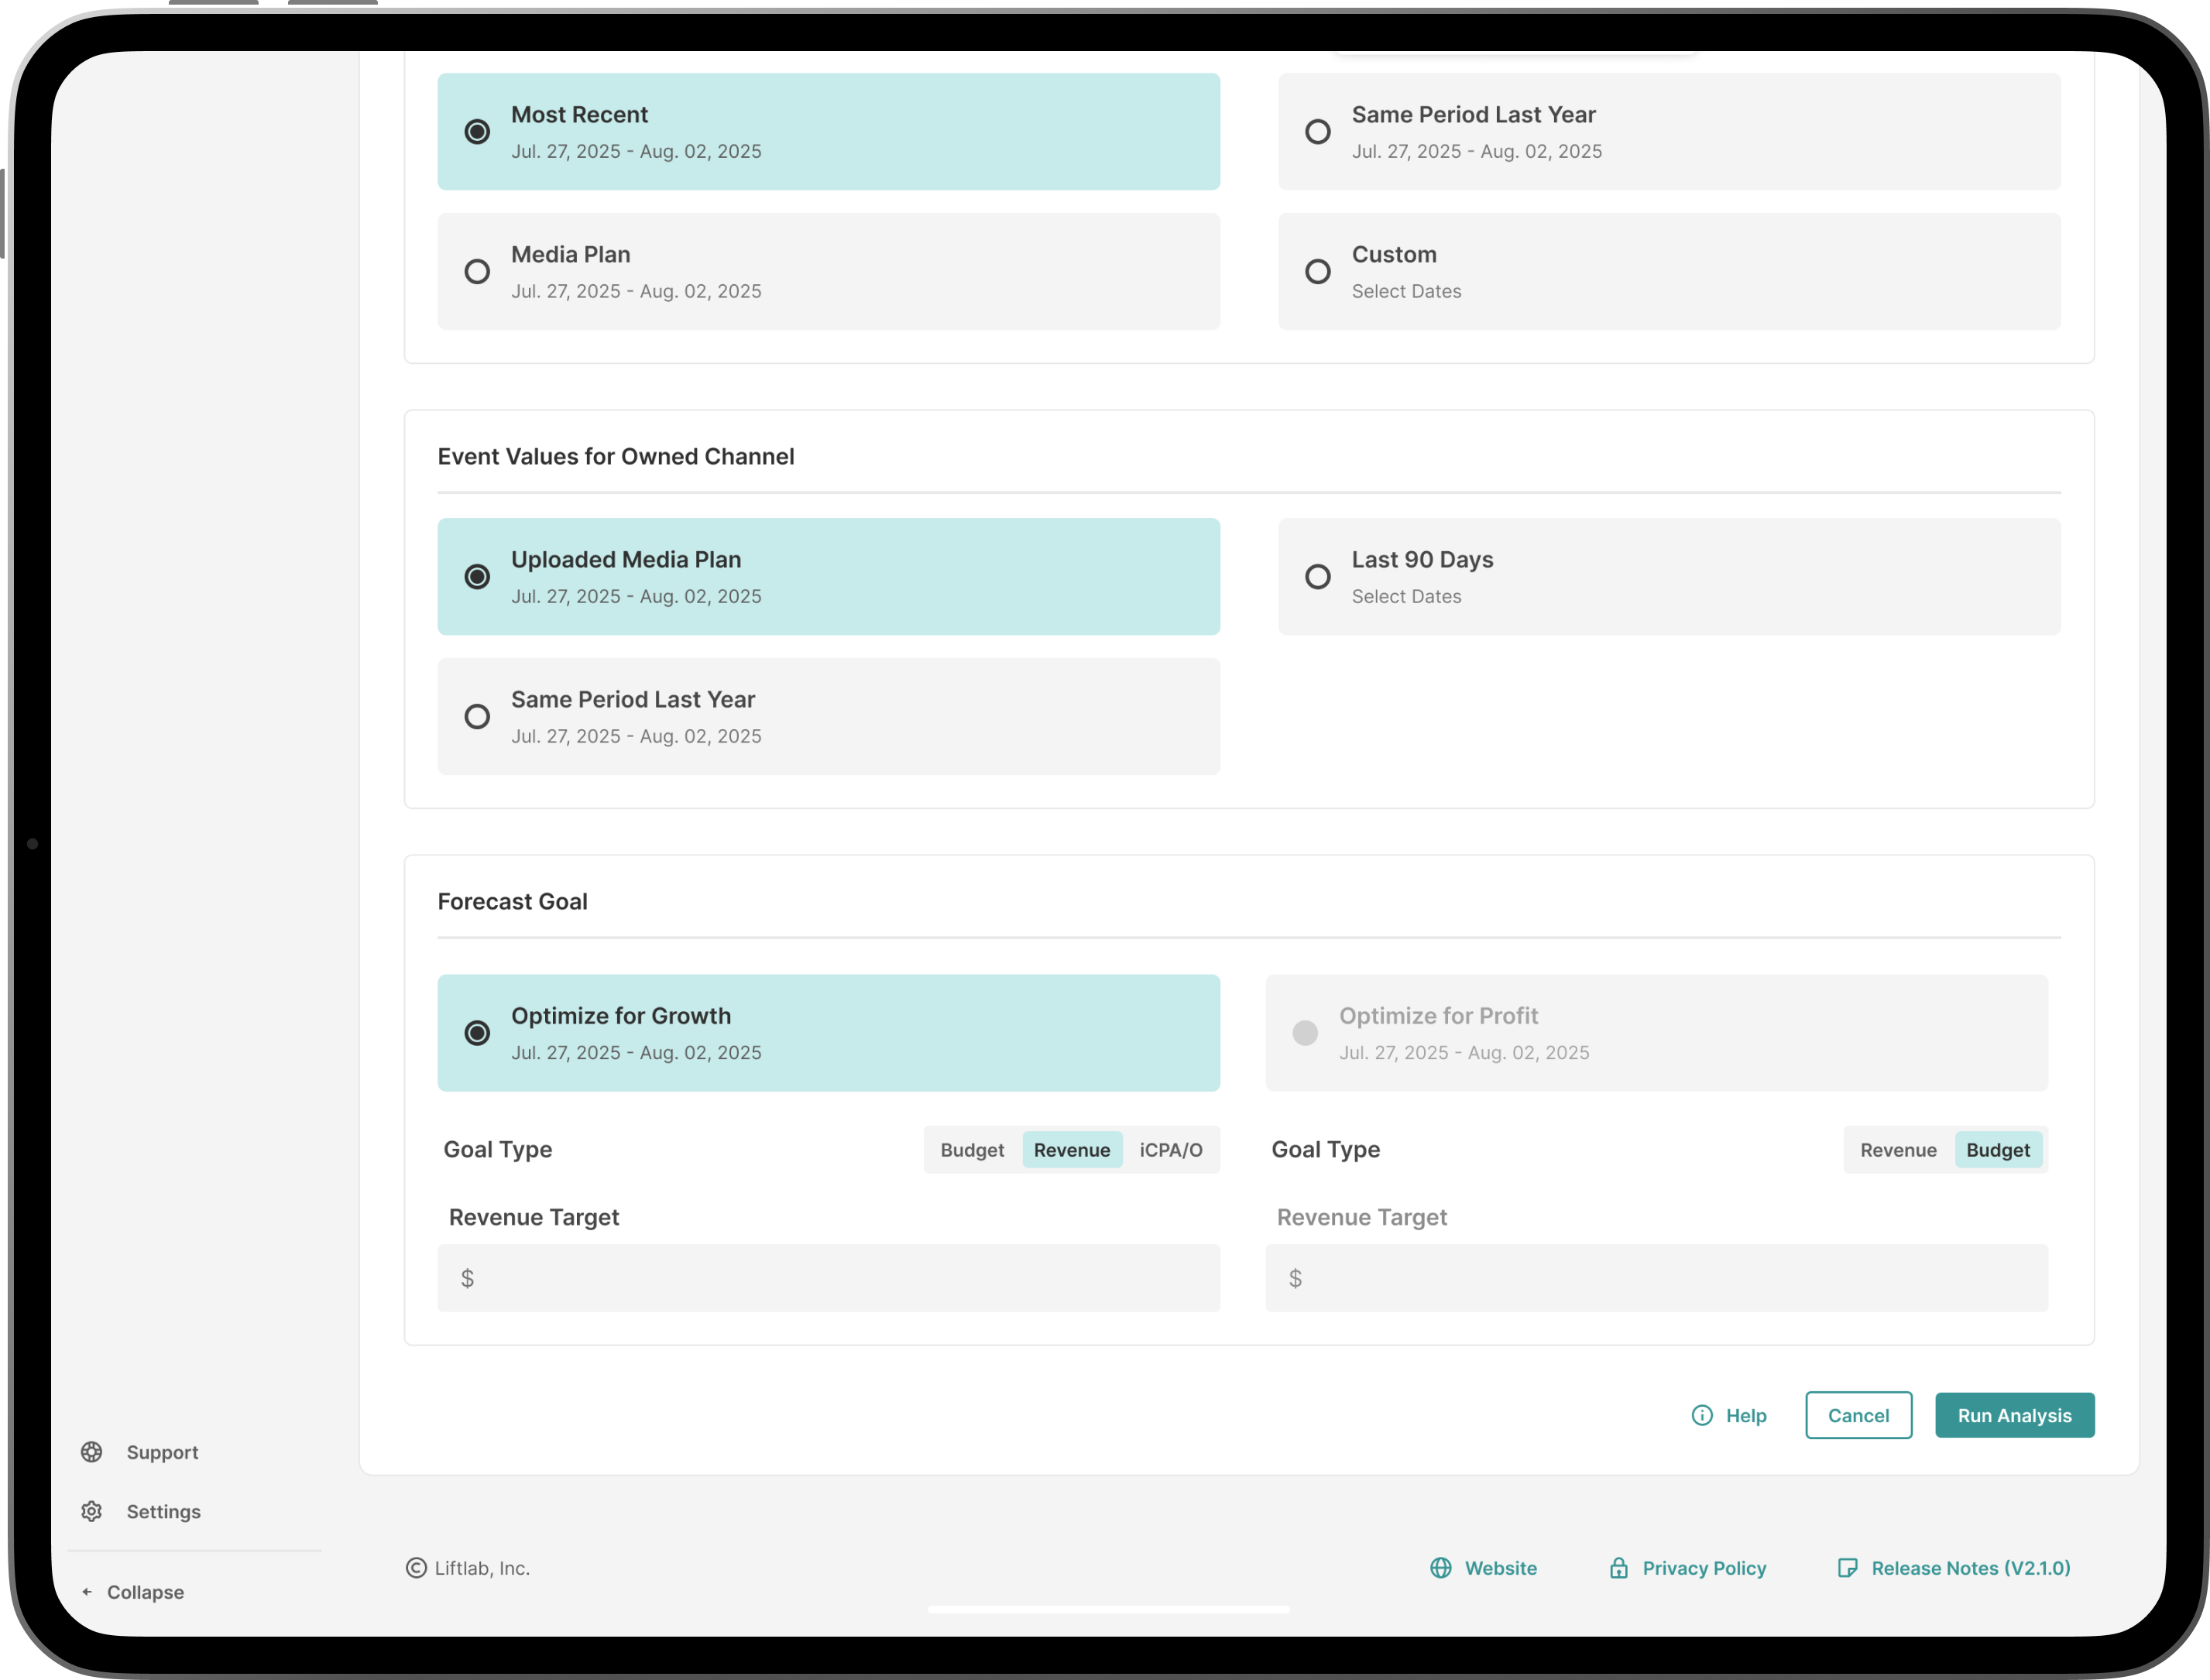
Default Settings — Forecast Goals
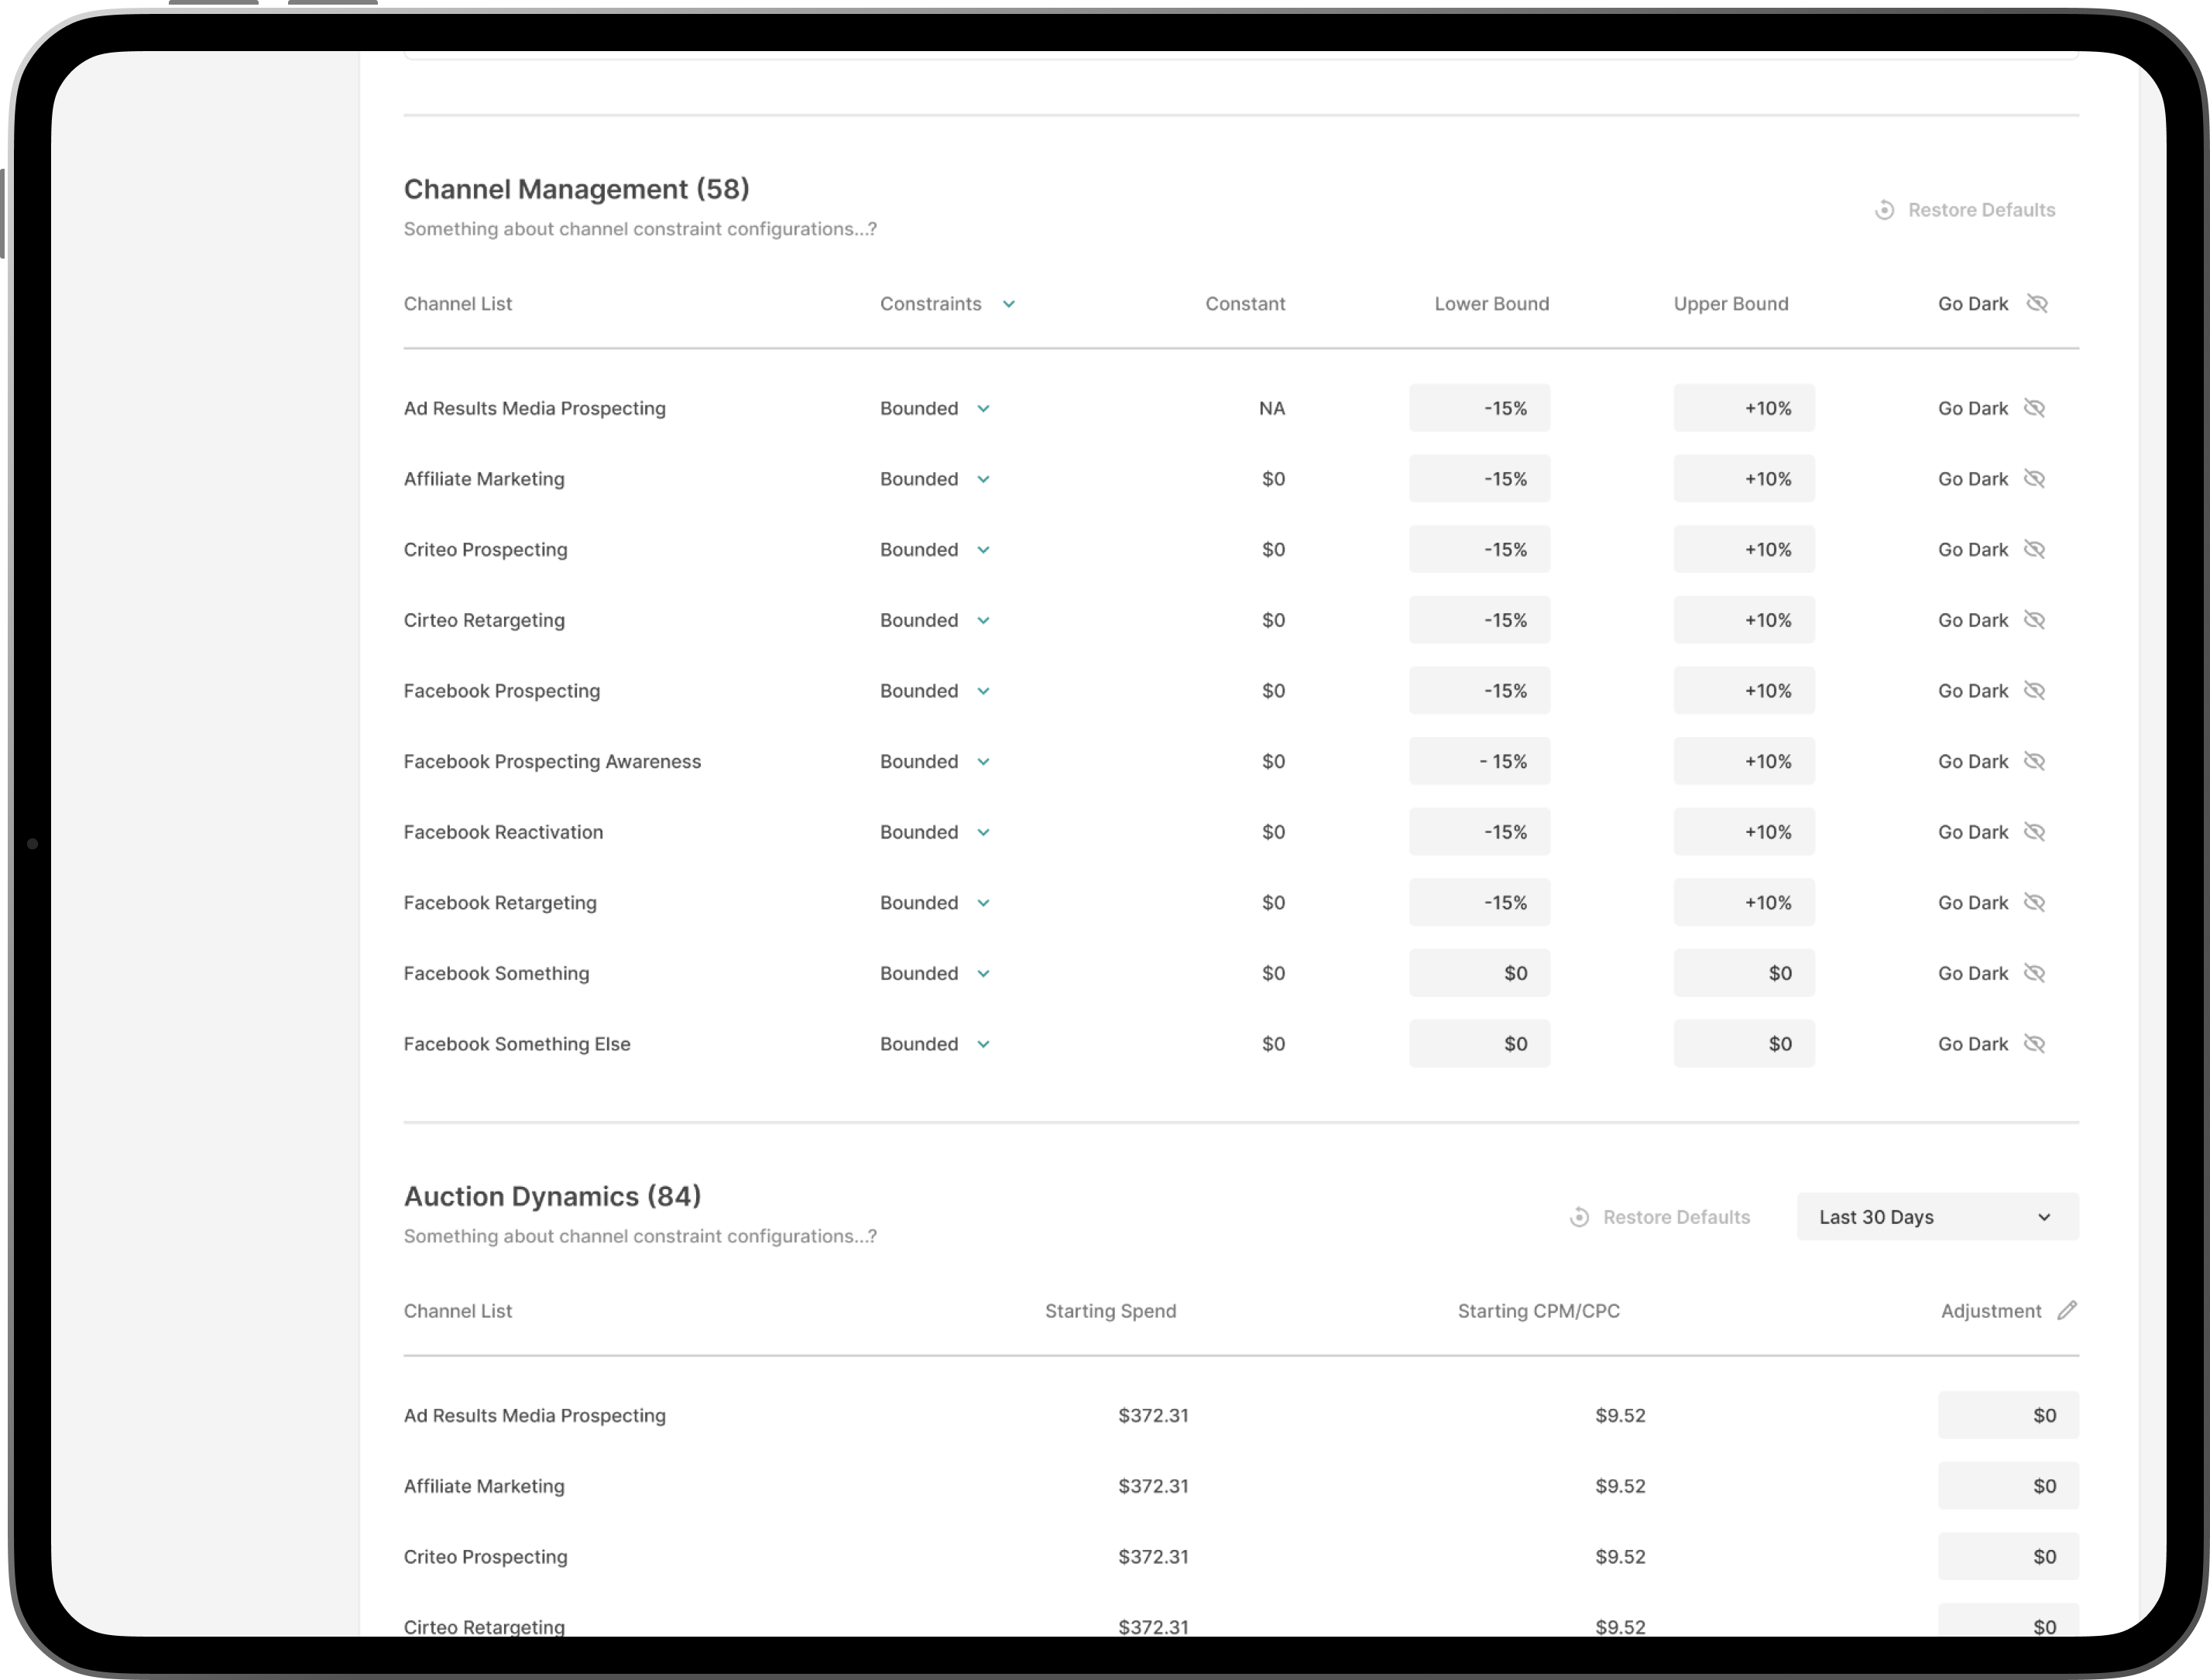
Advanced Settings Views
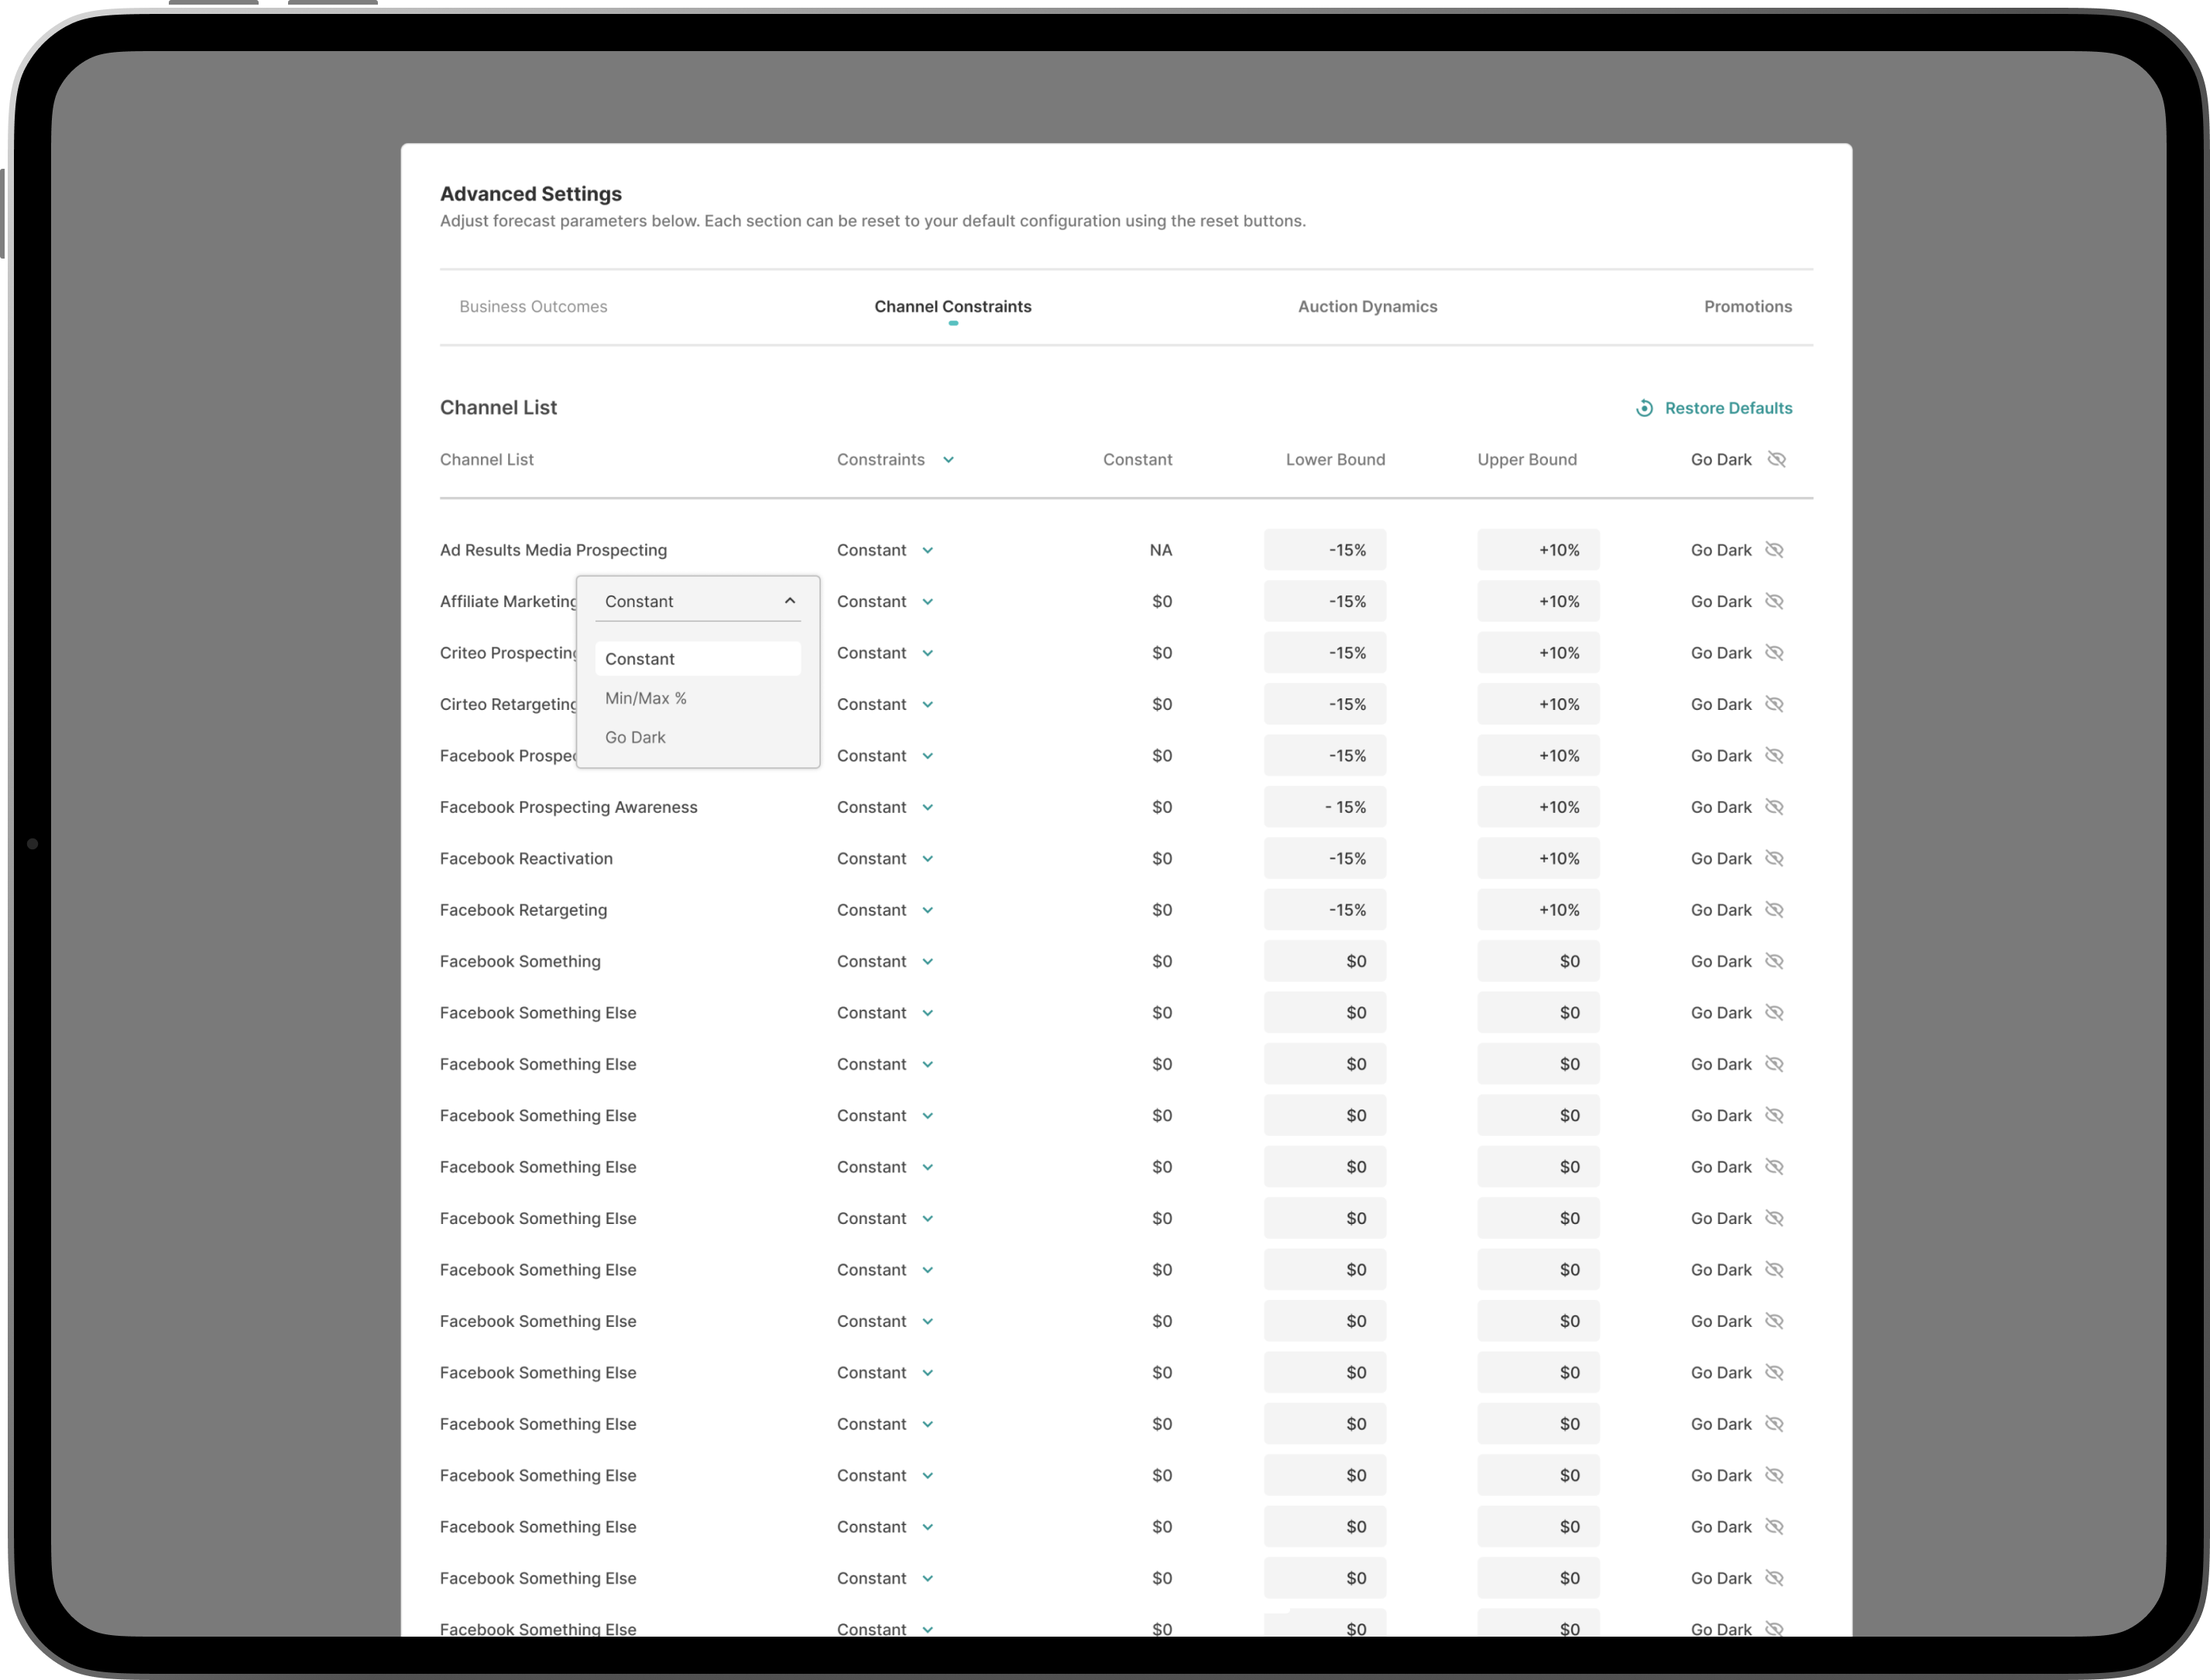
Advanced Settings Modal
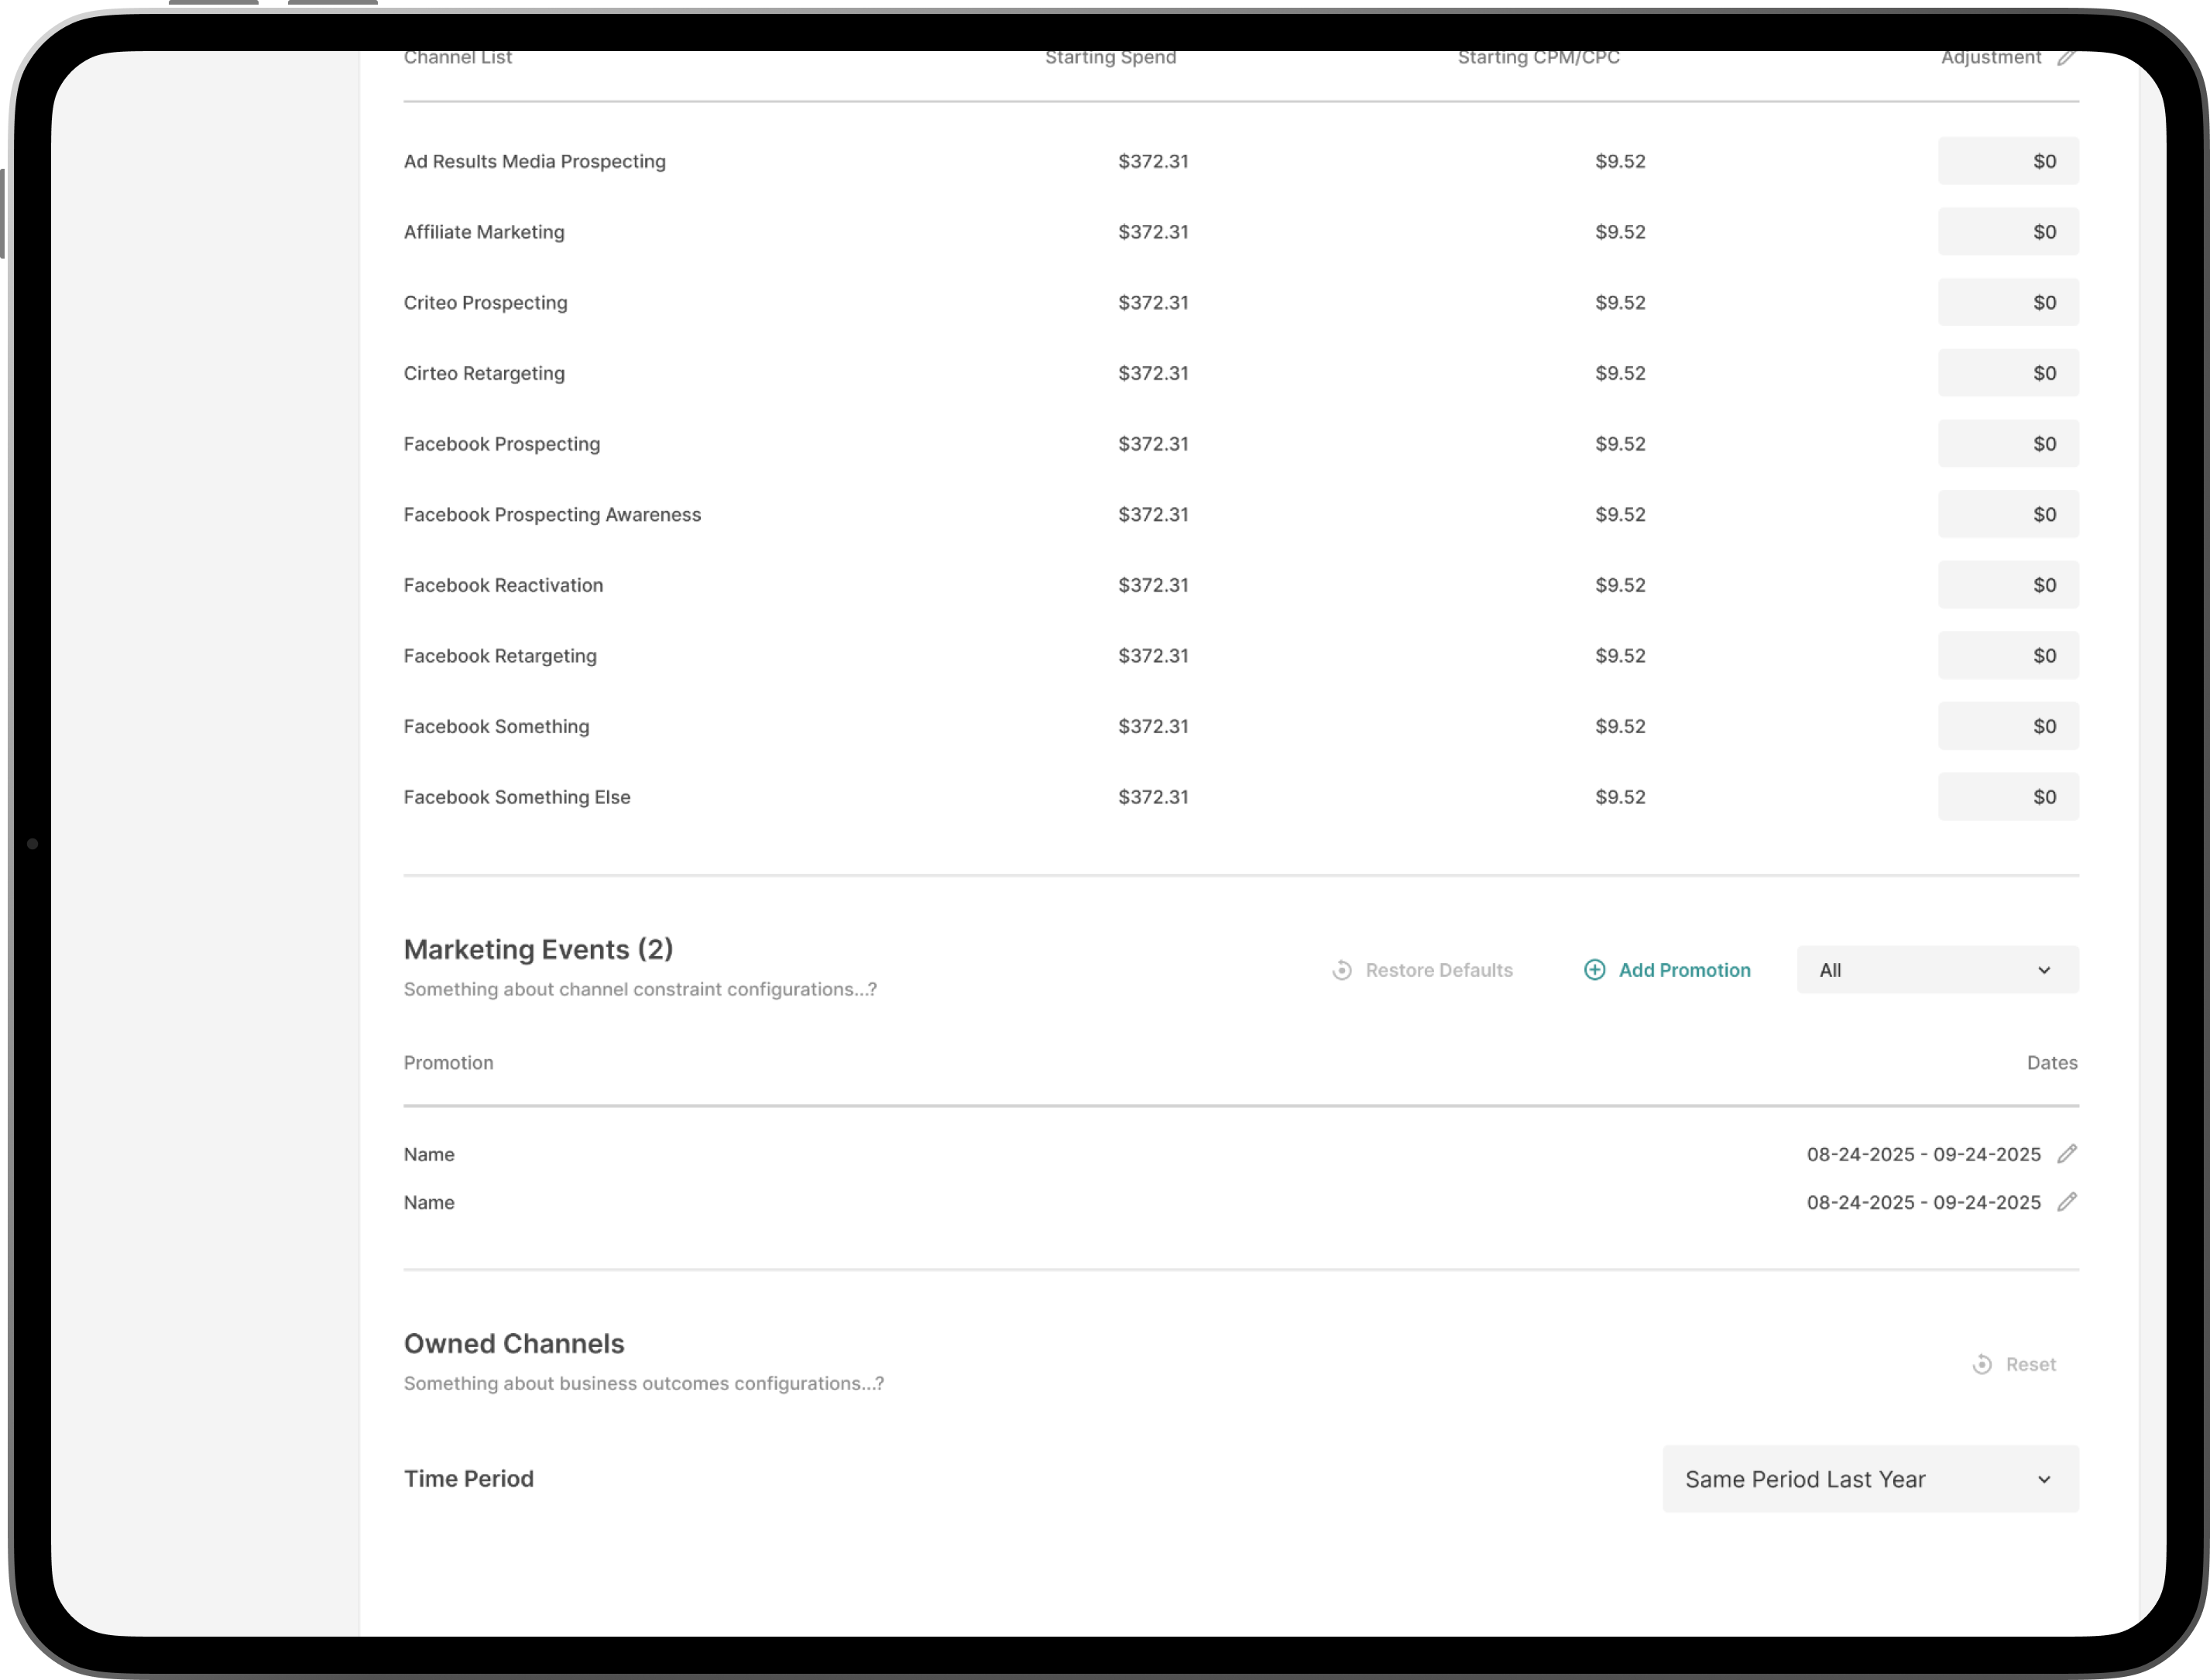
Light Settings — Scrolled Events
End-to-end design leadership
My process included market research, user interviews, wireframes, interactive prototypes, stakeholder reviews, and close collaboration with engineering for implementation. In partnership with product, data science, and CSMs, I led the full design cycle from discovery through launch.
Discovery
Conducted user interviews, market research, and usability sessions to identify pain points, missing functionality, and opportunities to elevate the core user experience.
Wireframes
Created low and mid-fidelity wireframes to test user flows, information architecture, and interaction patterns across desktop and tablet breakpoints.
User Testing
Ran structured testing sessions with existing enterprise beta clients and power users, iterating on prototypes before moving to high-fidelity visual design.
Final Designs & Delivery
Delivered fully annotated high-fidelity designs, component specs, and interactive prototypes — enabling engineering to ship the new UI with confidence and speed.
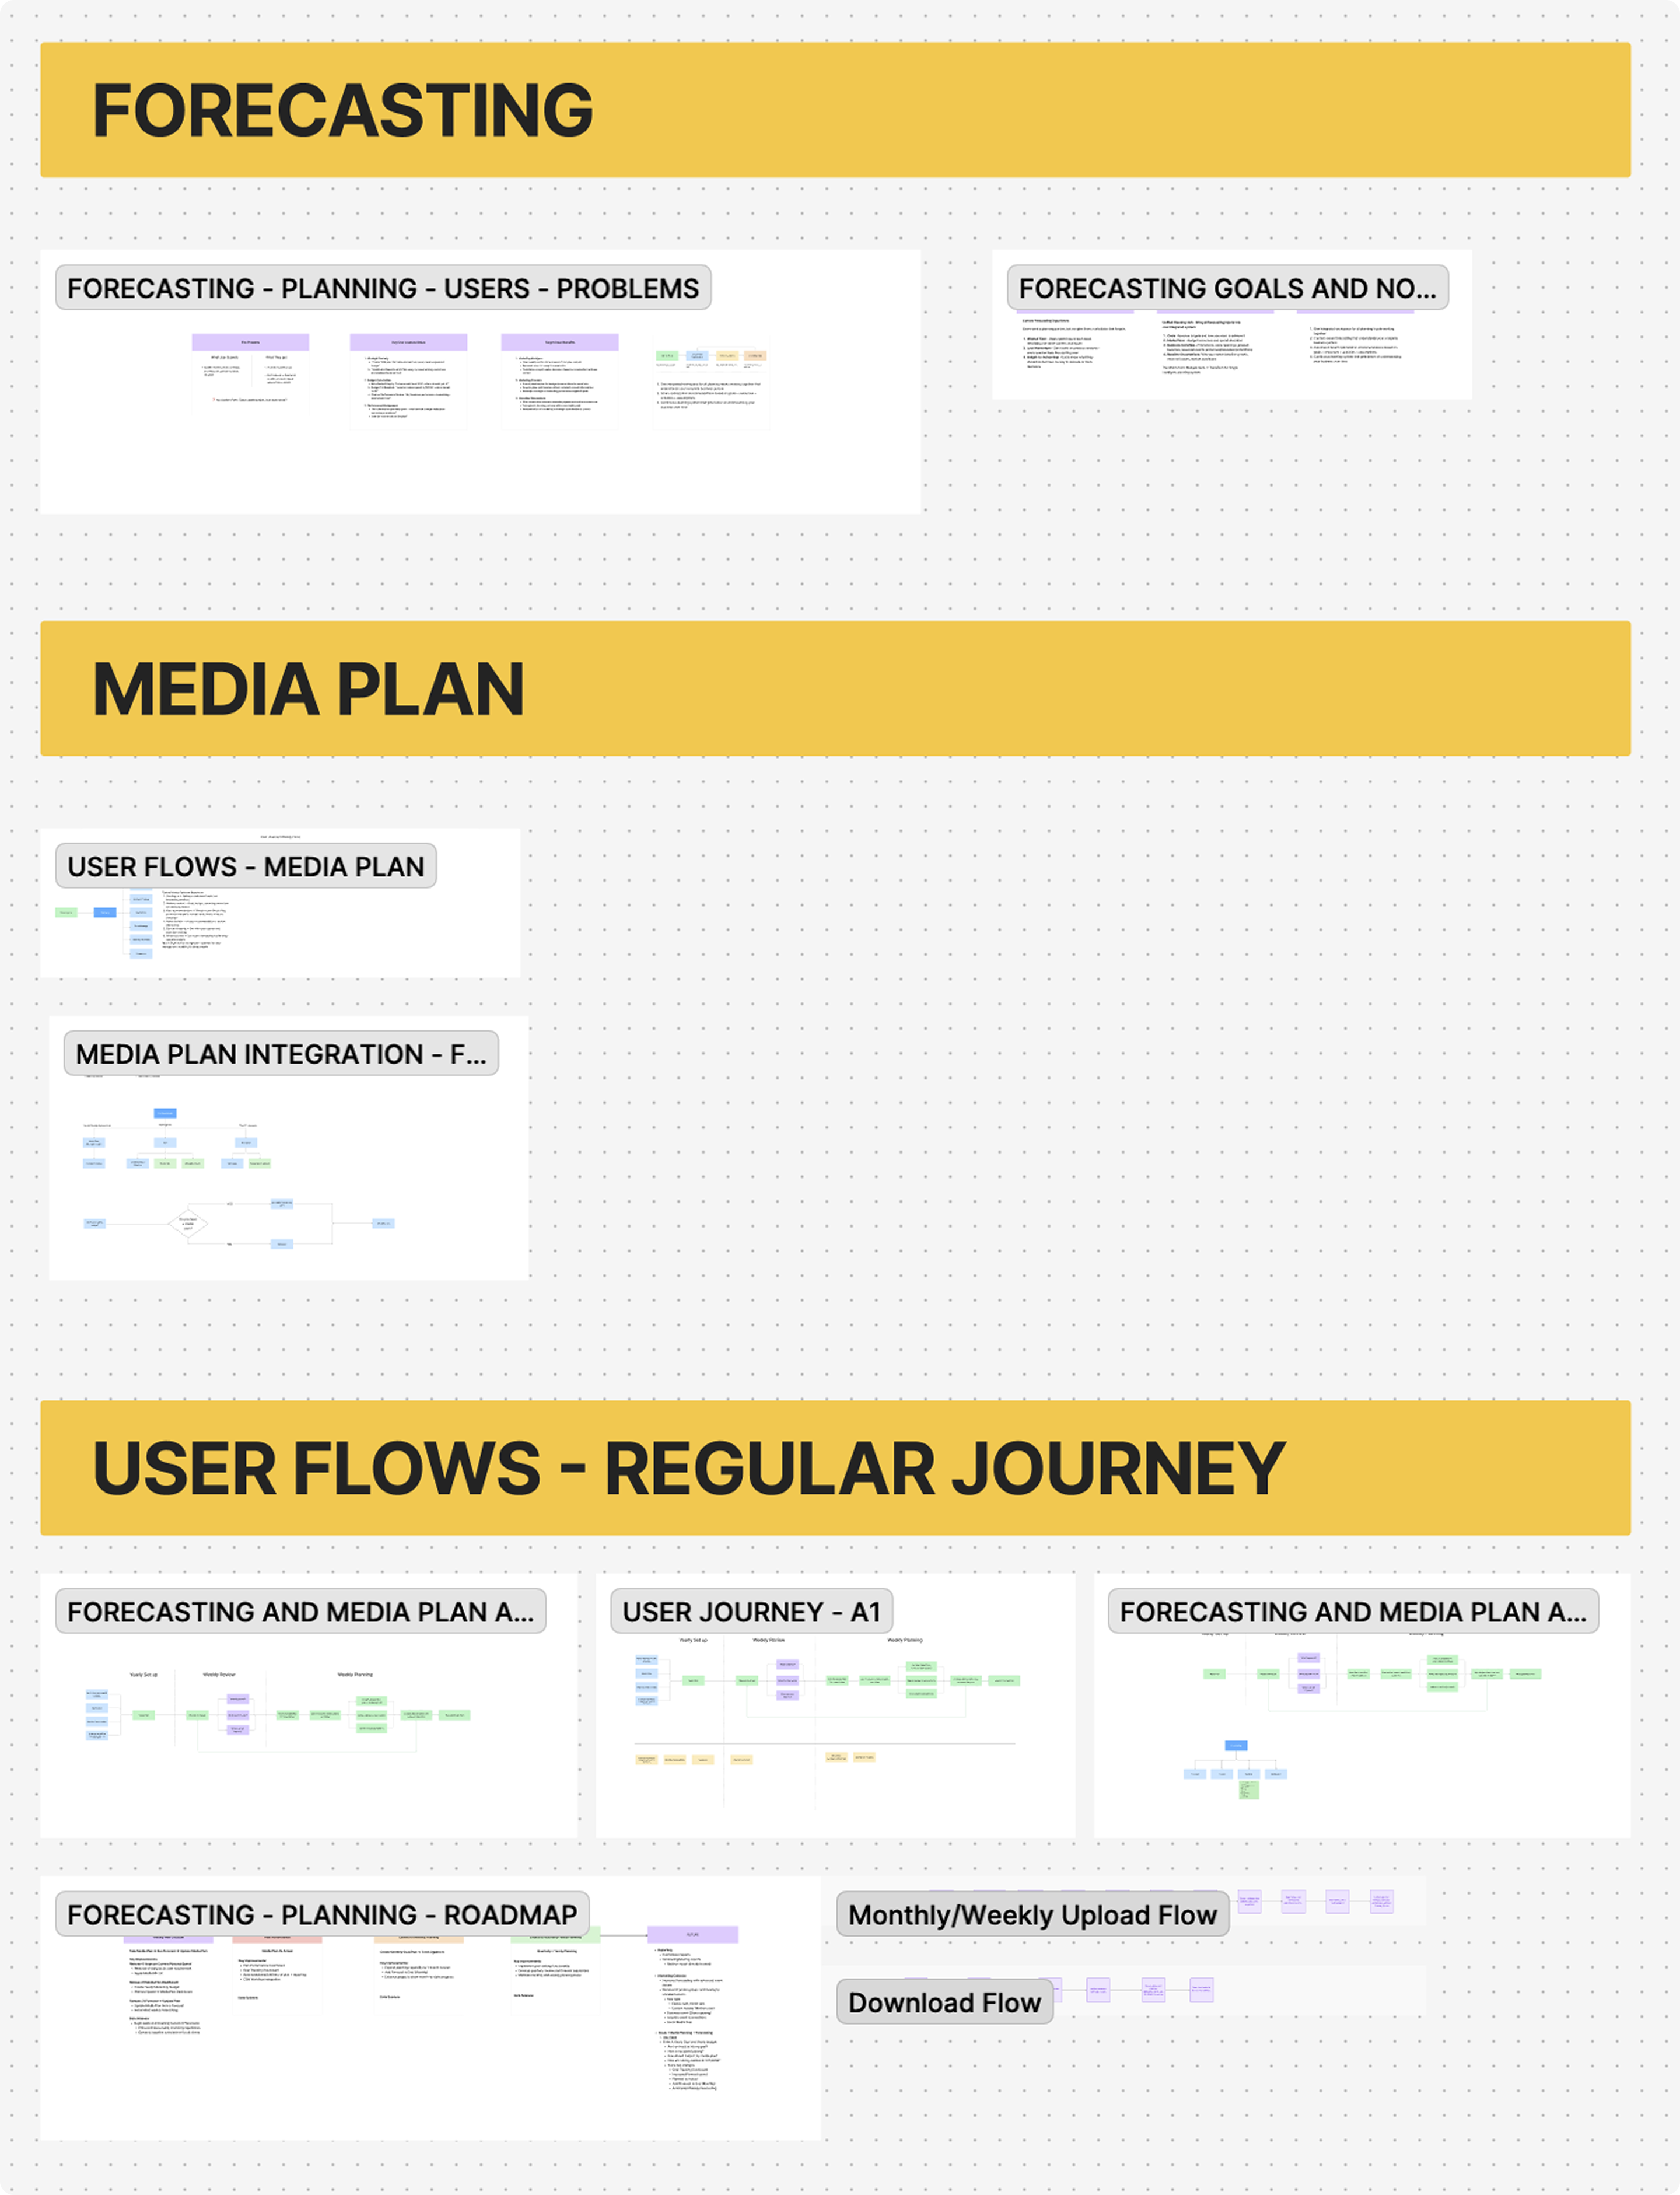
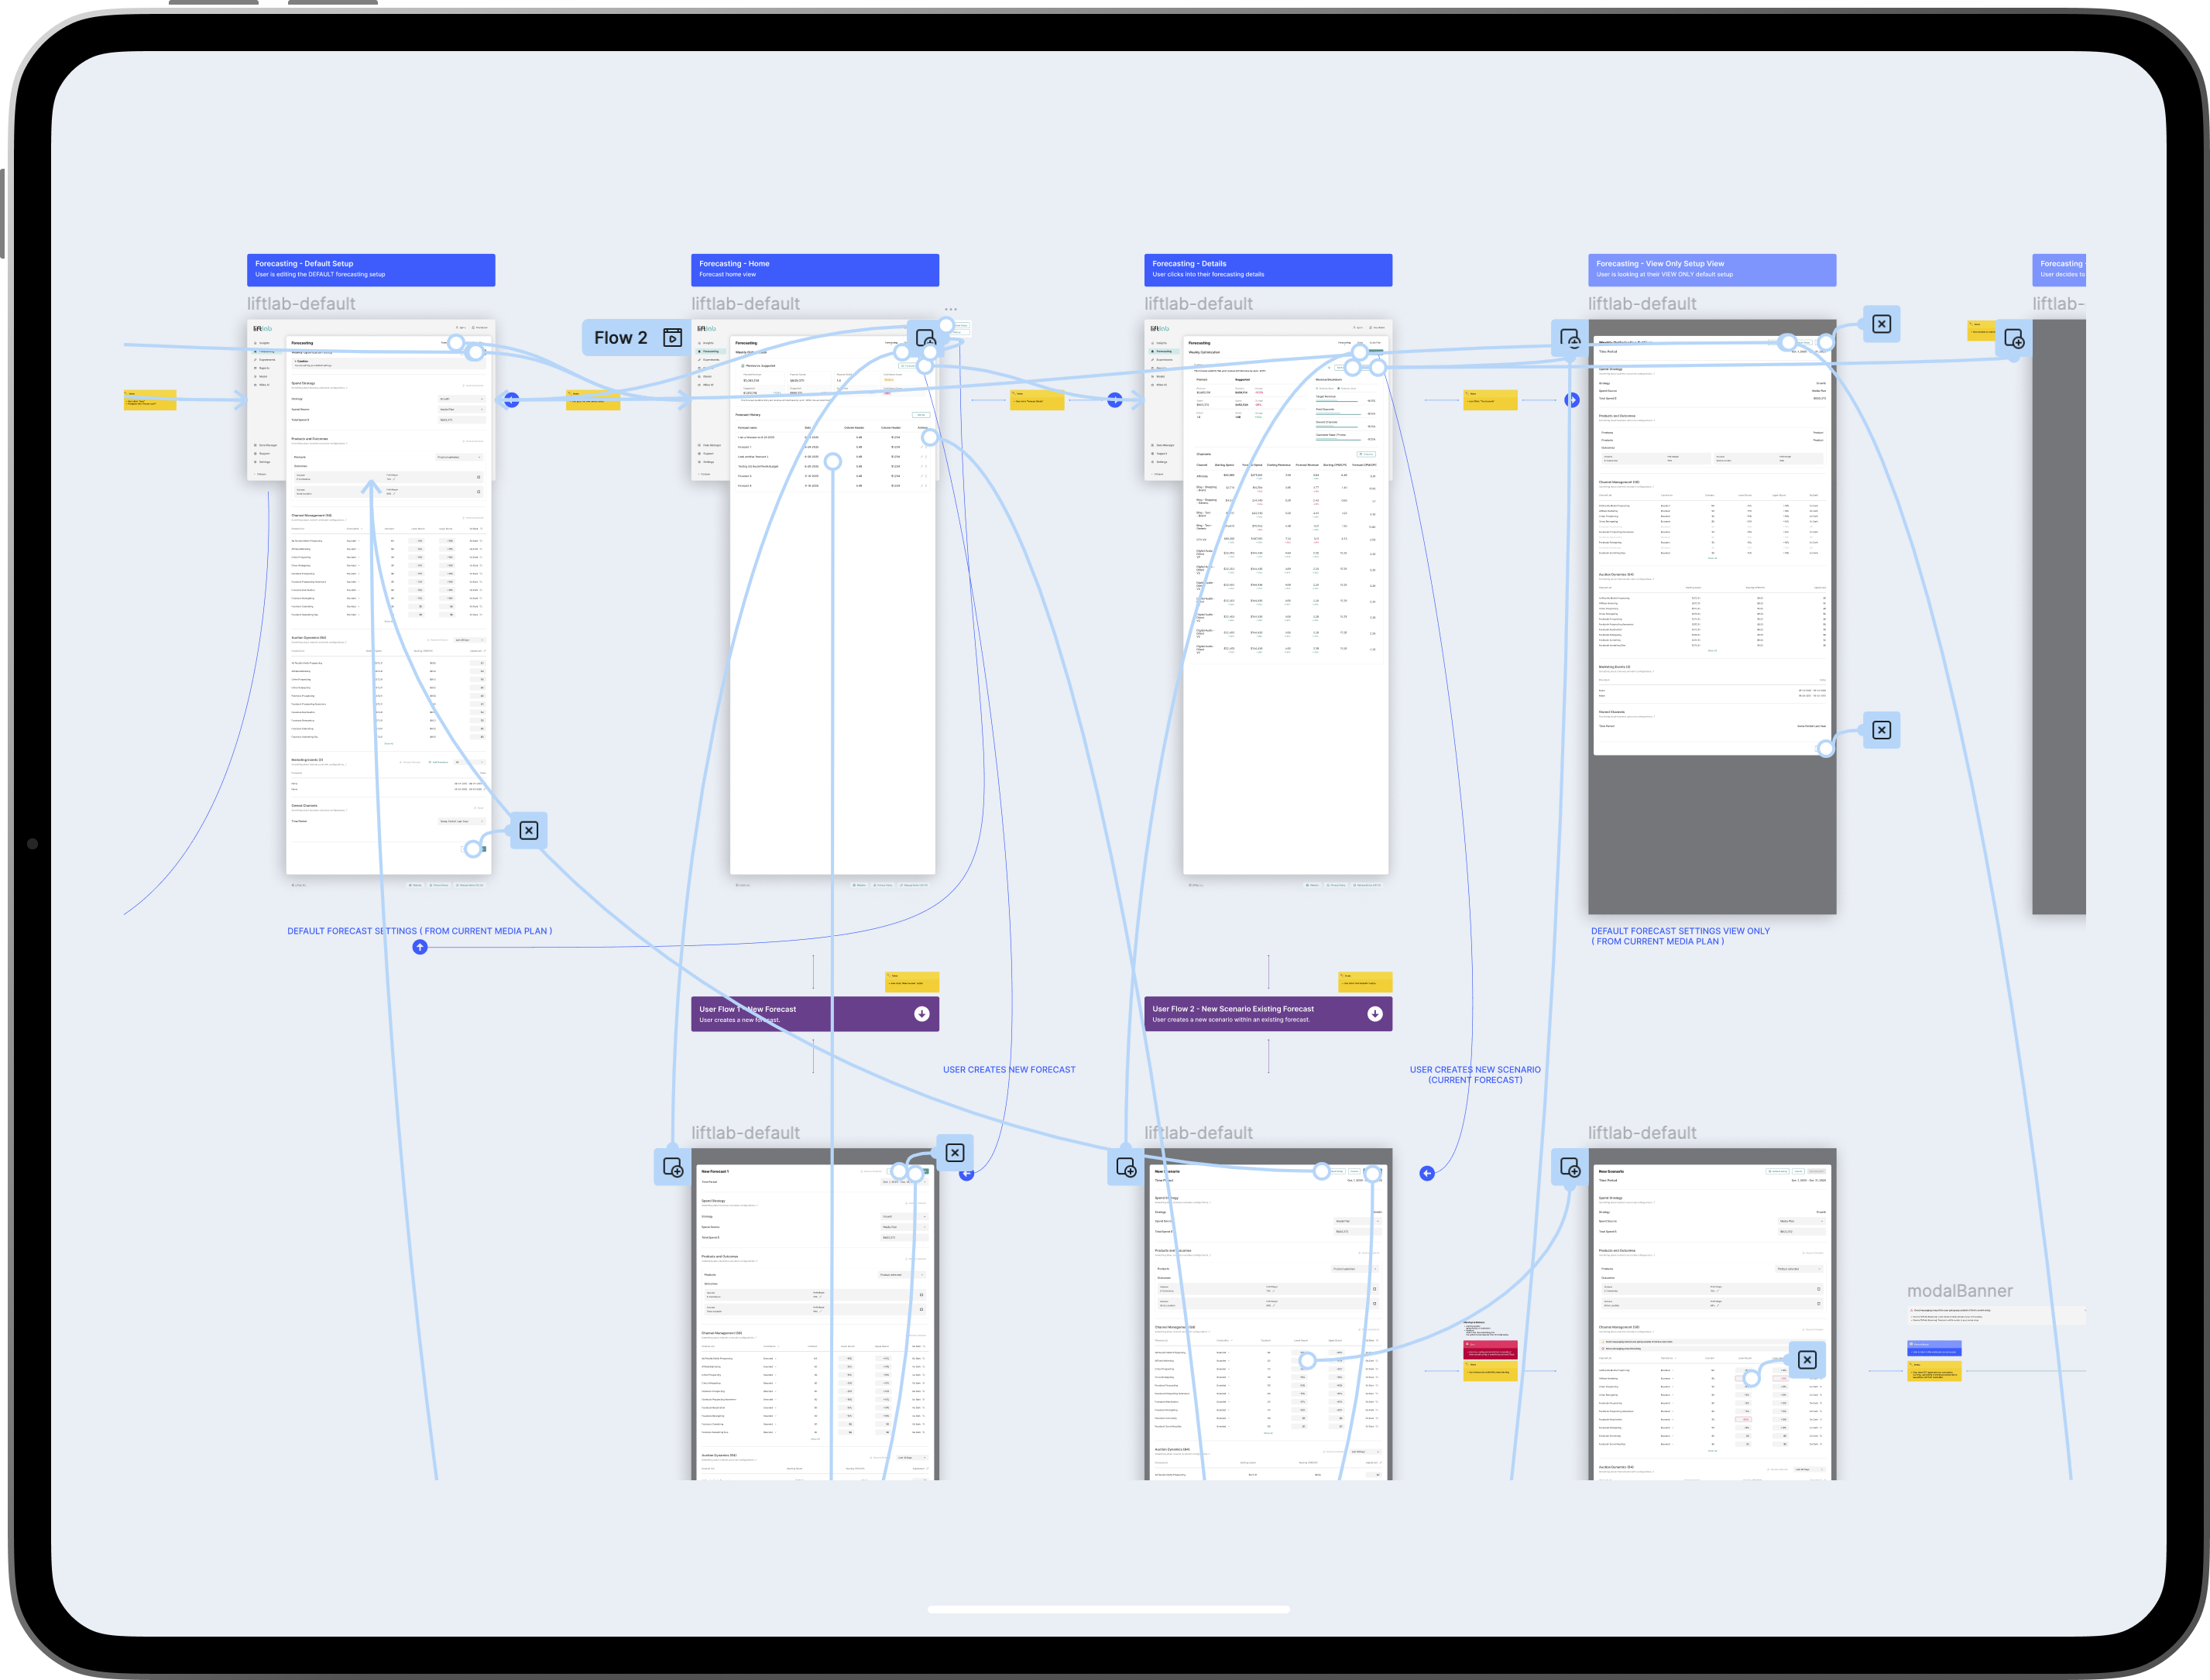
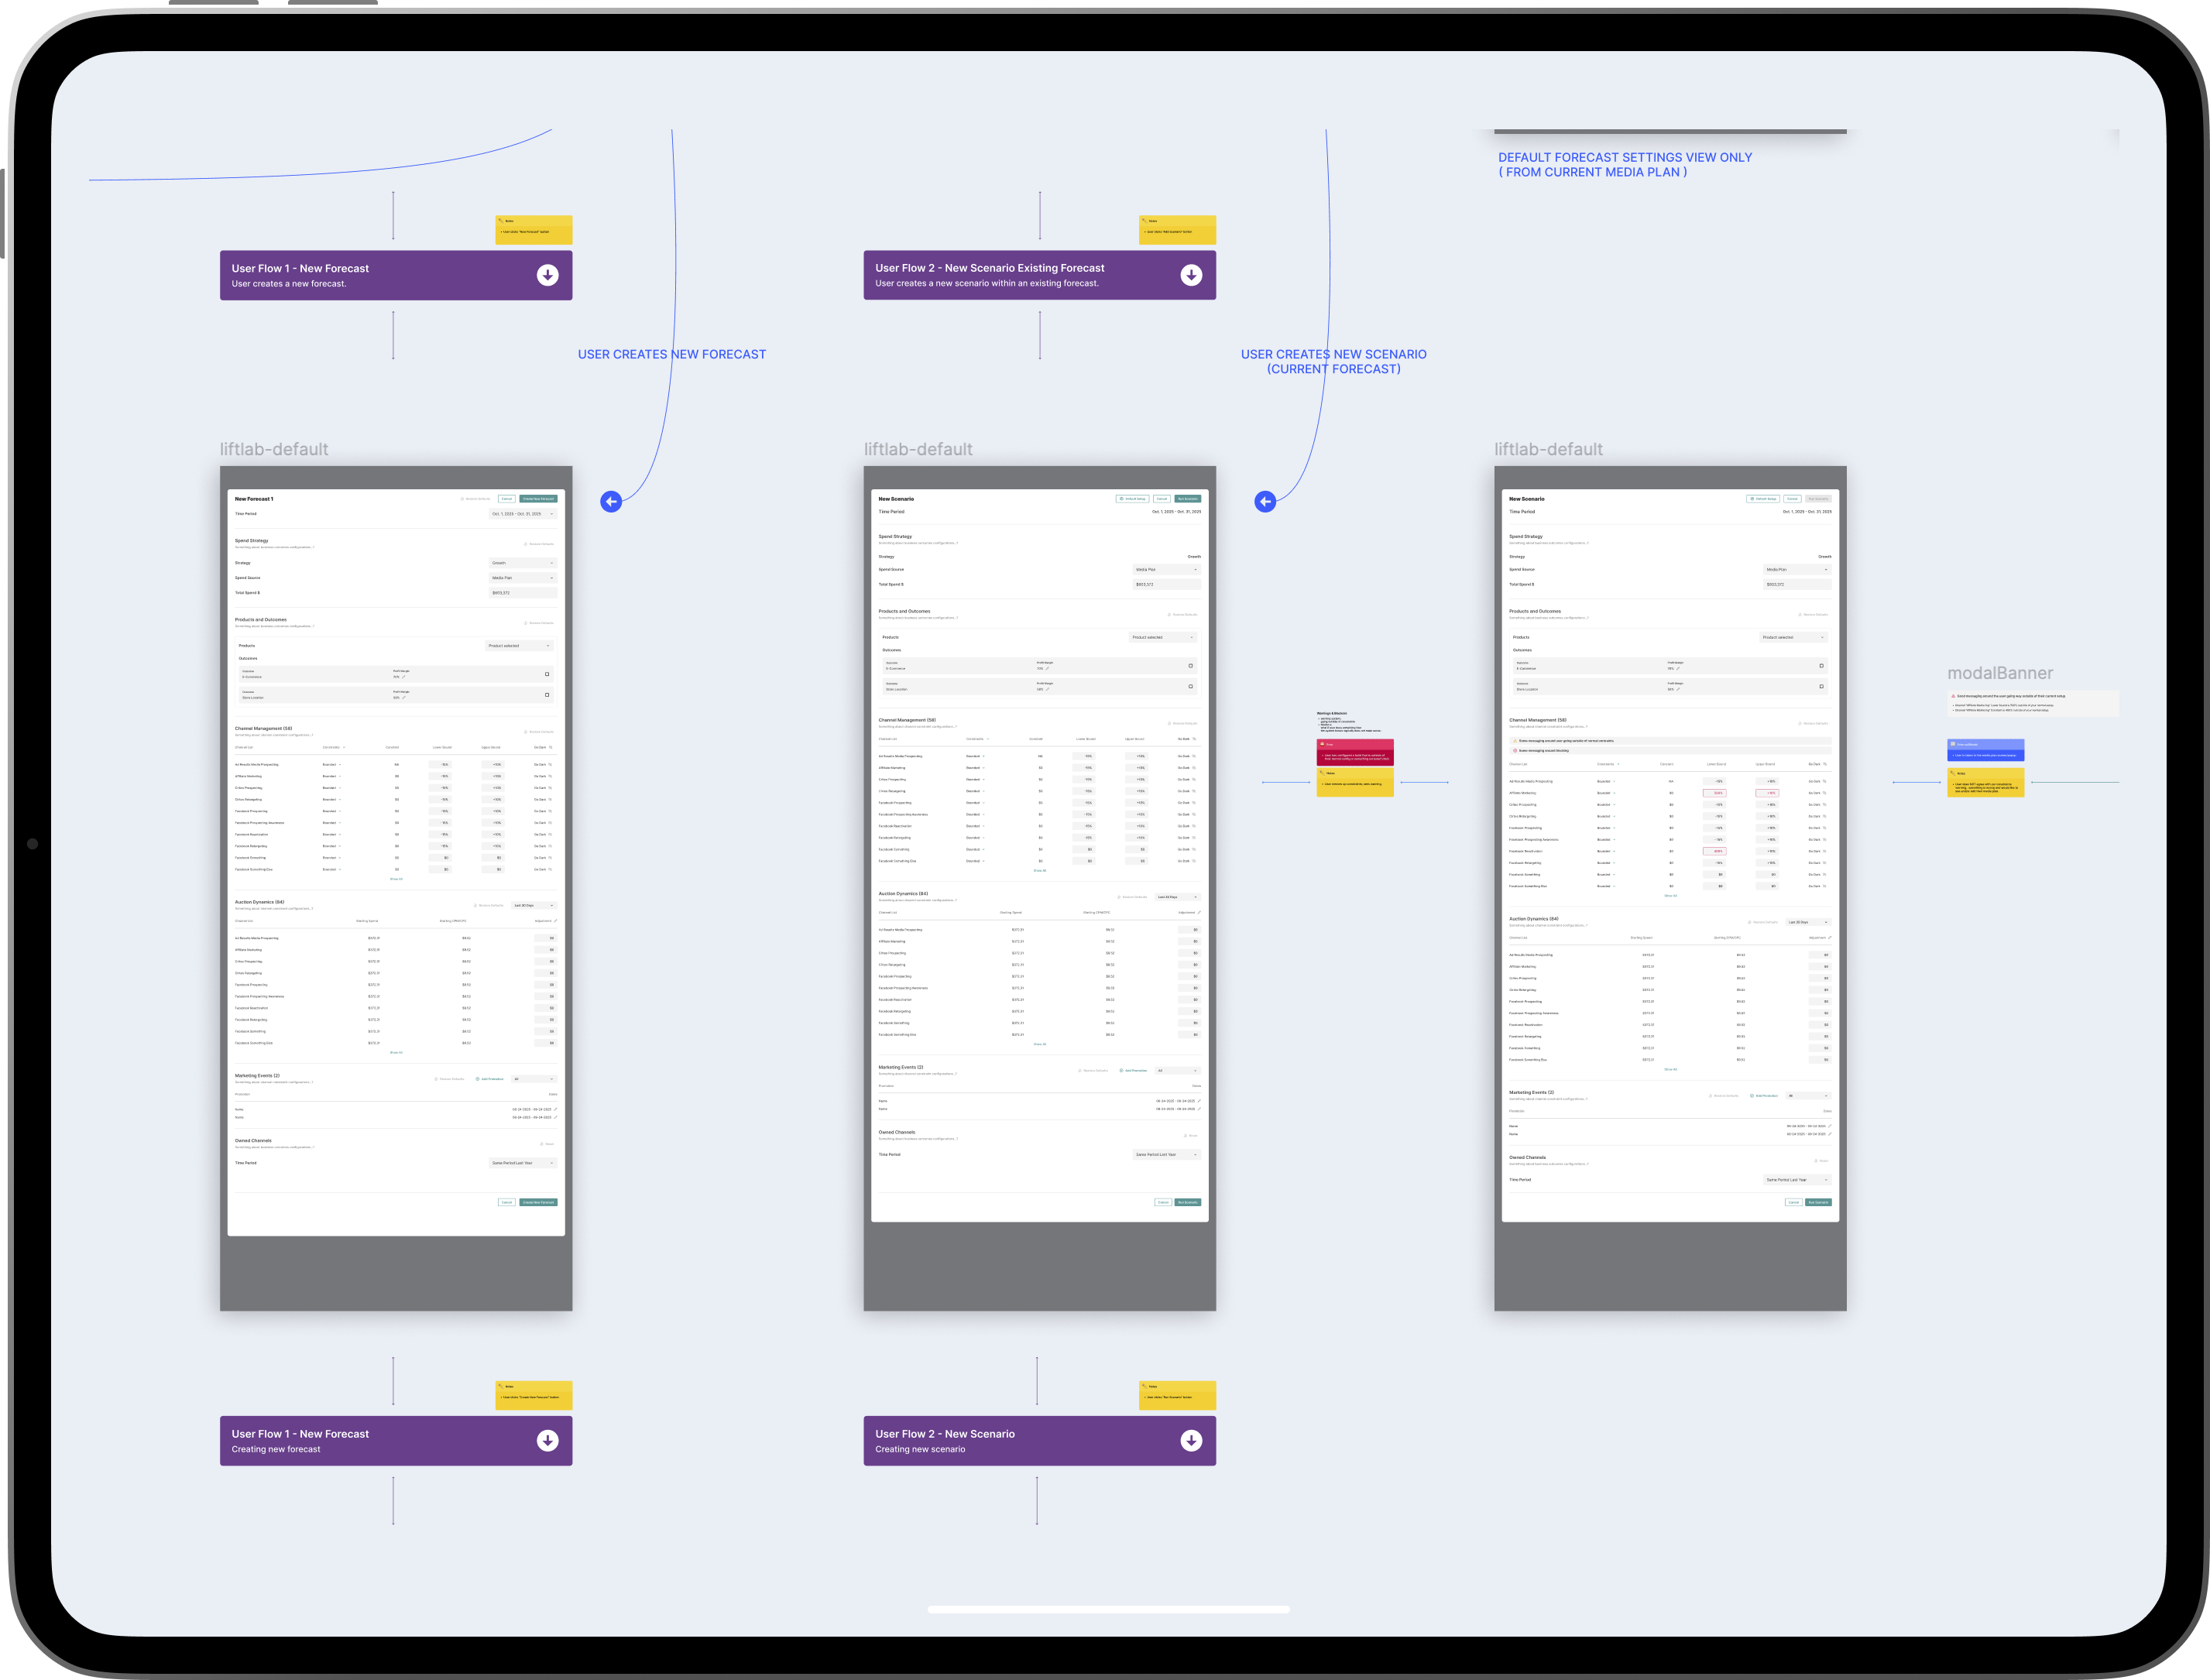
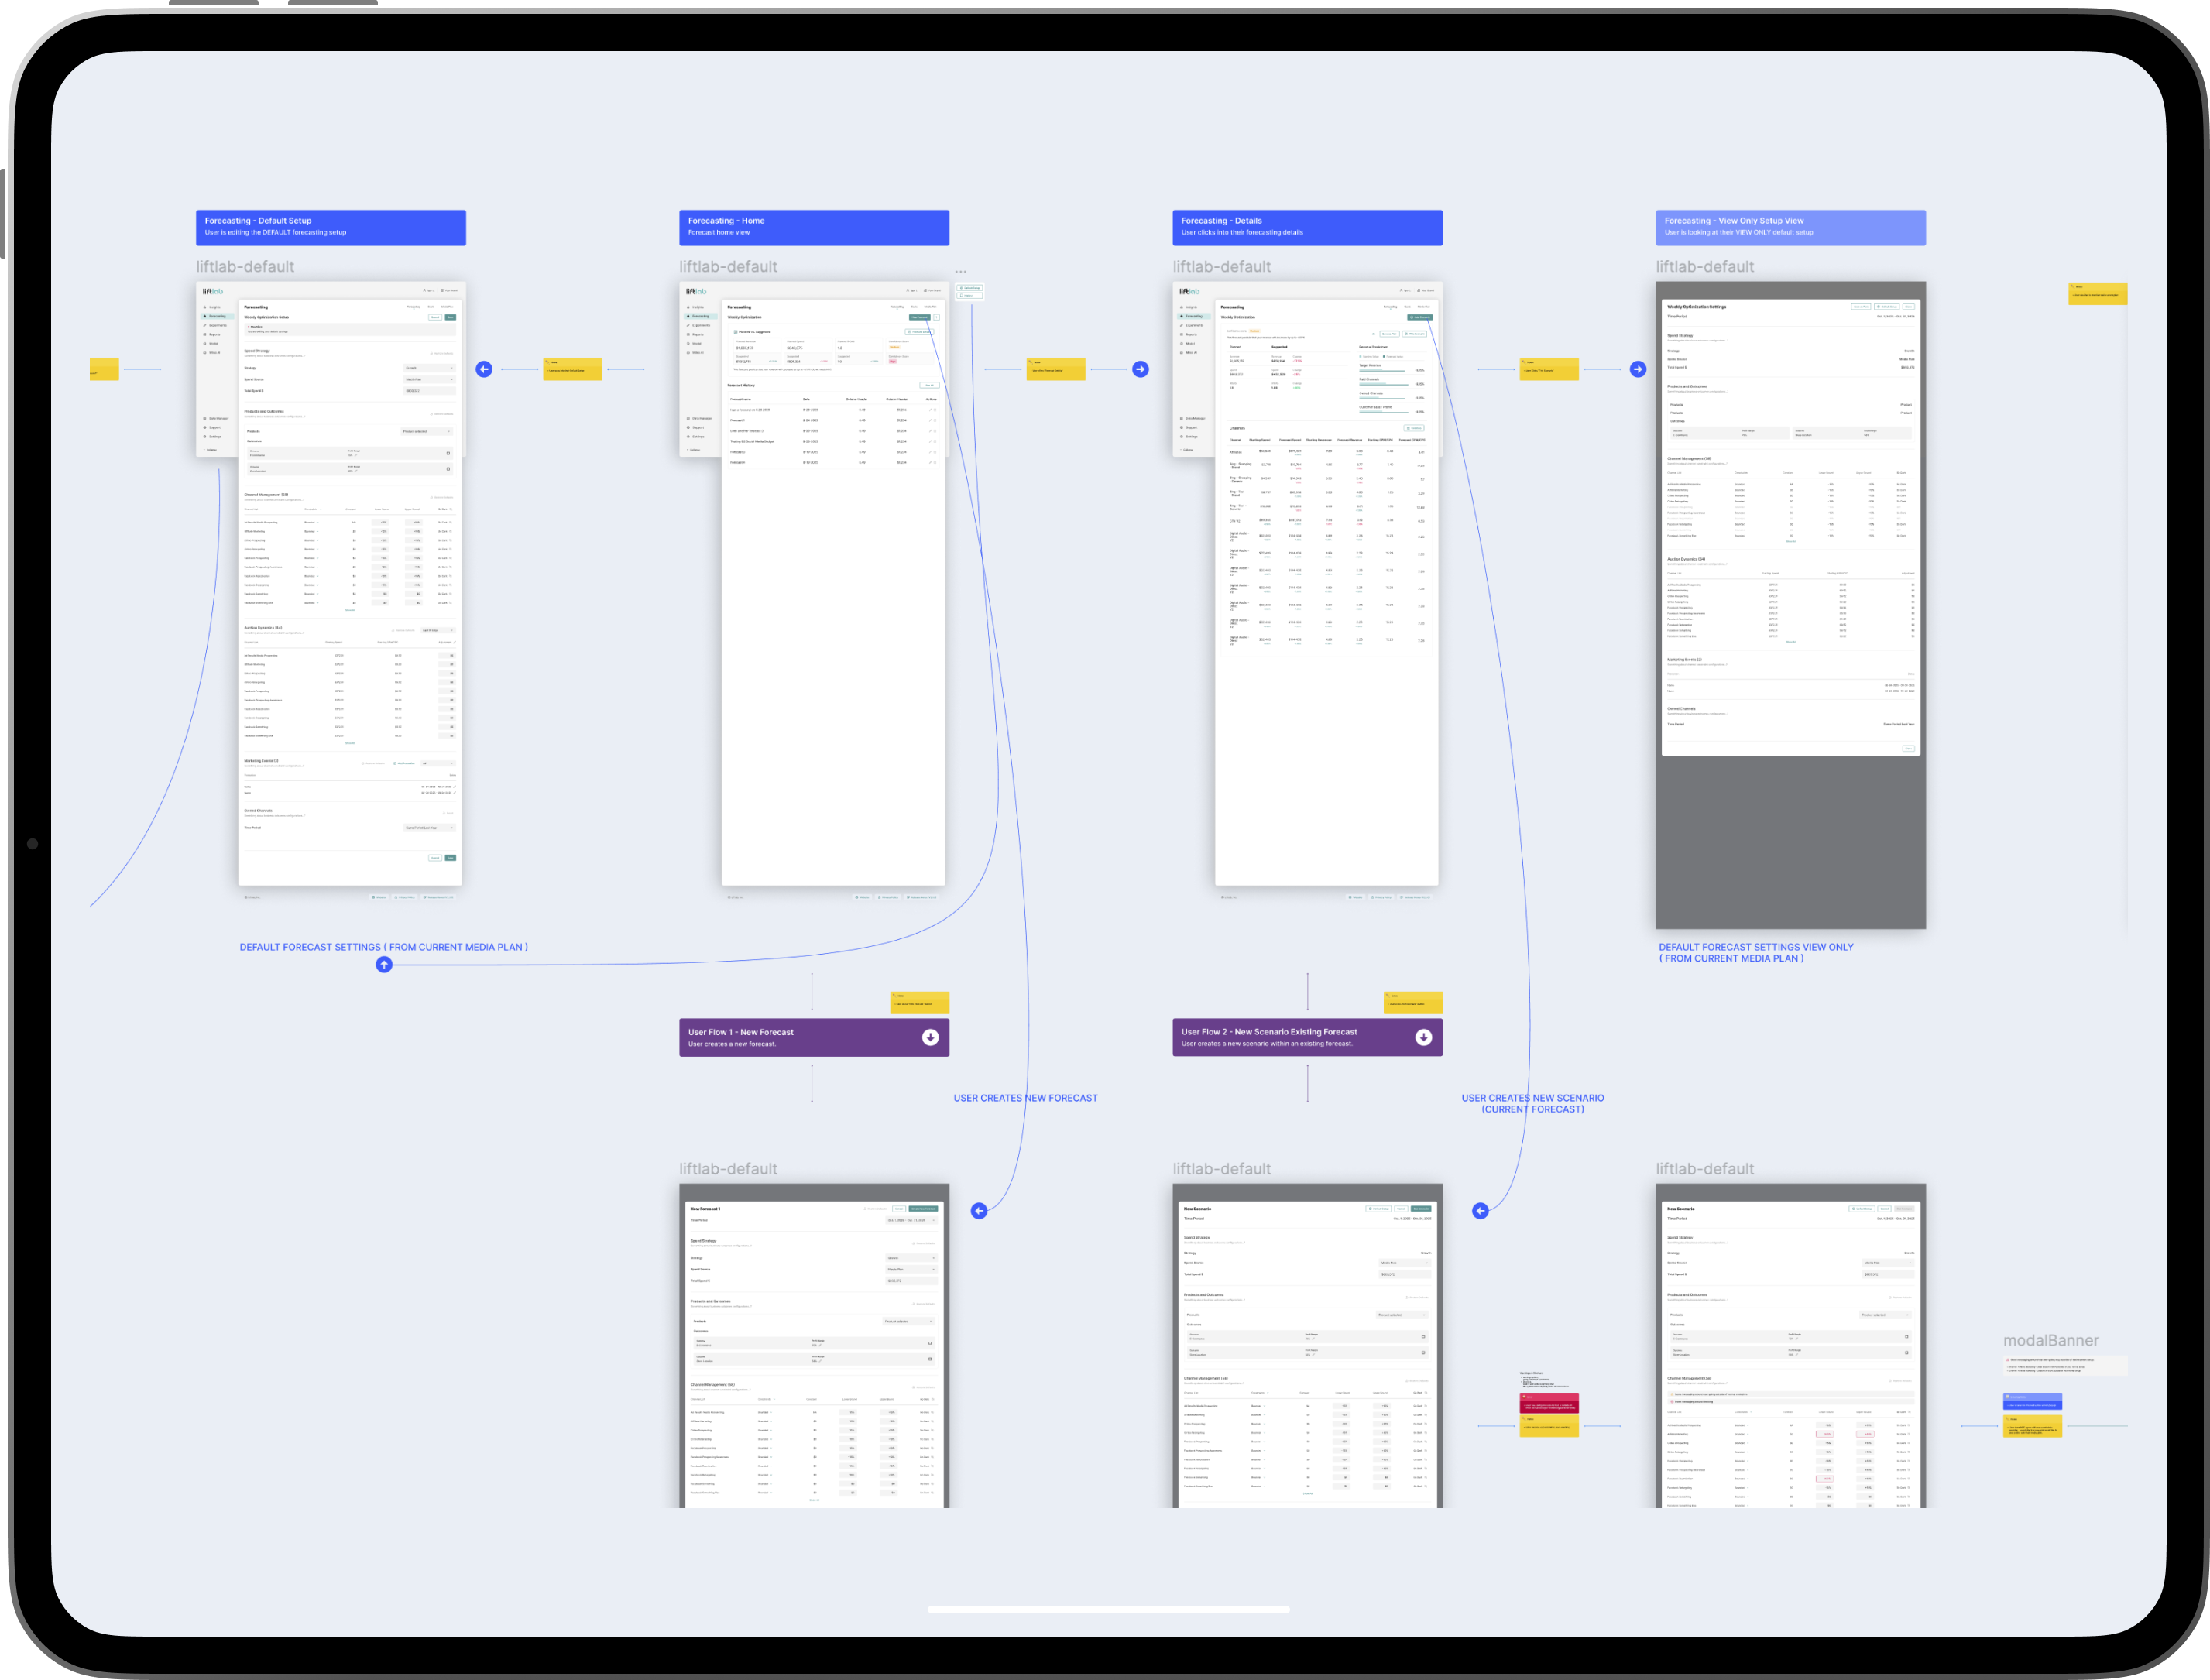
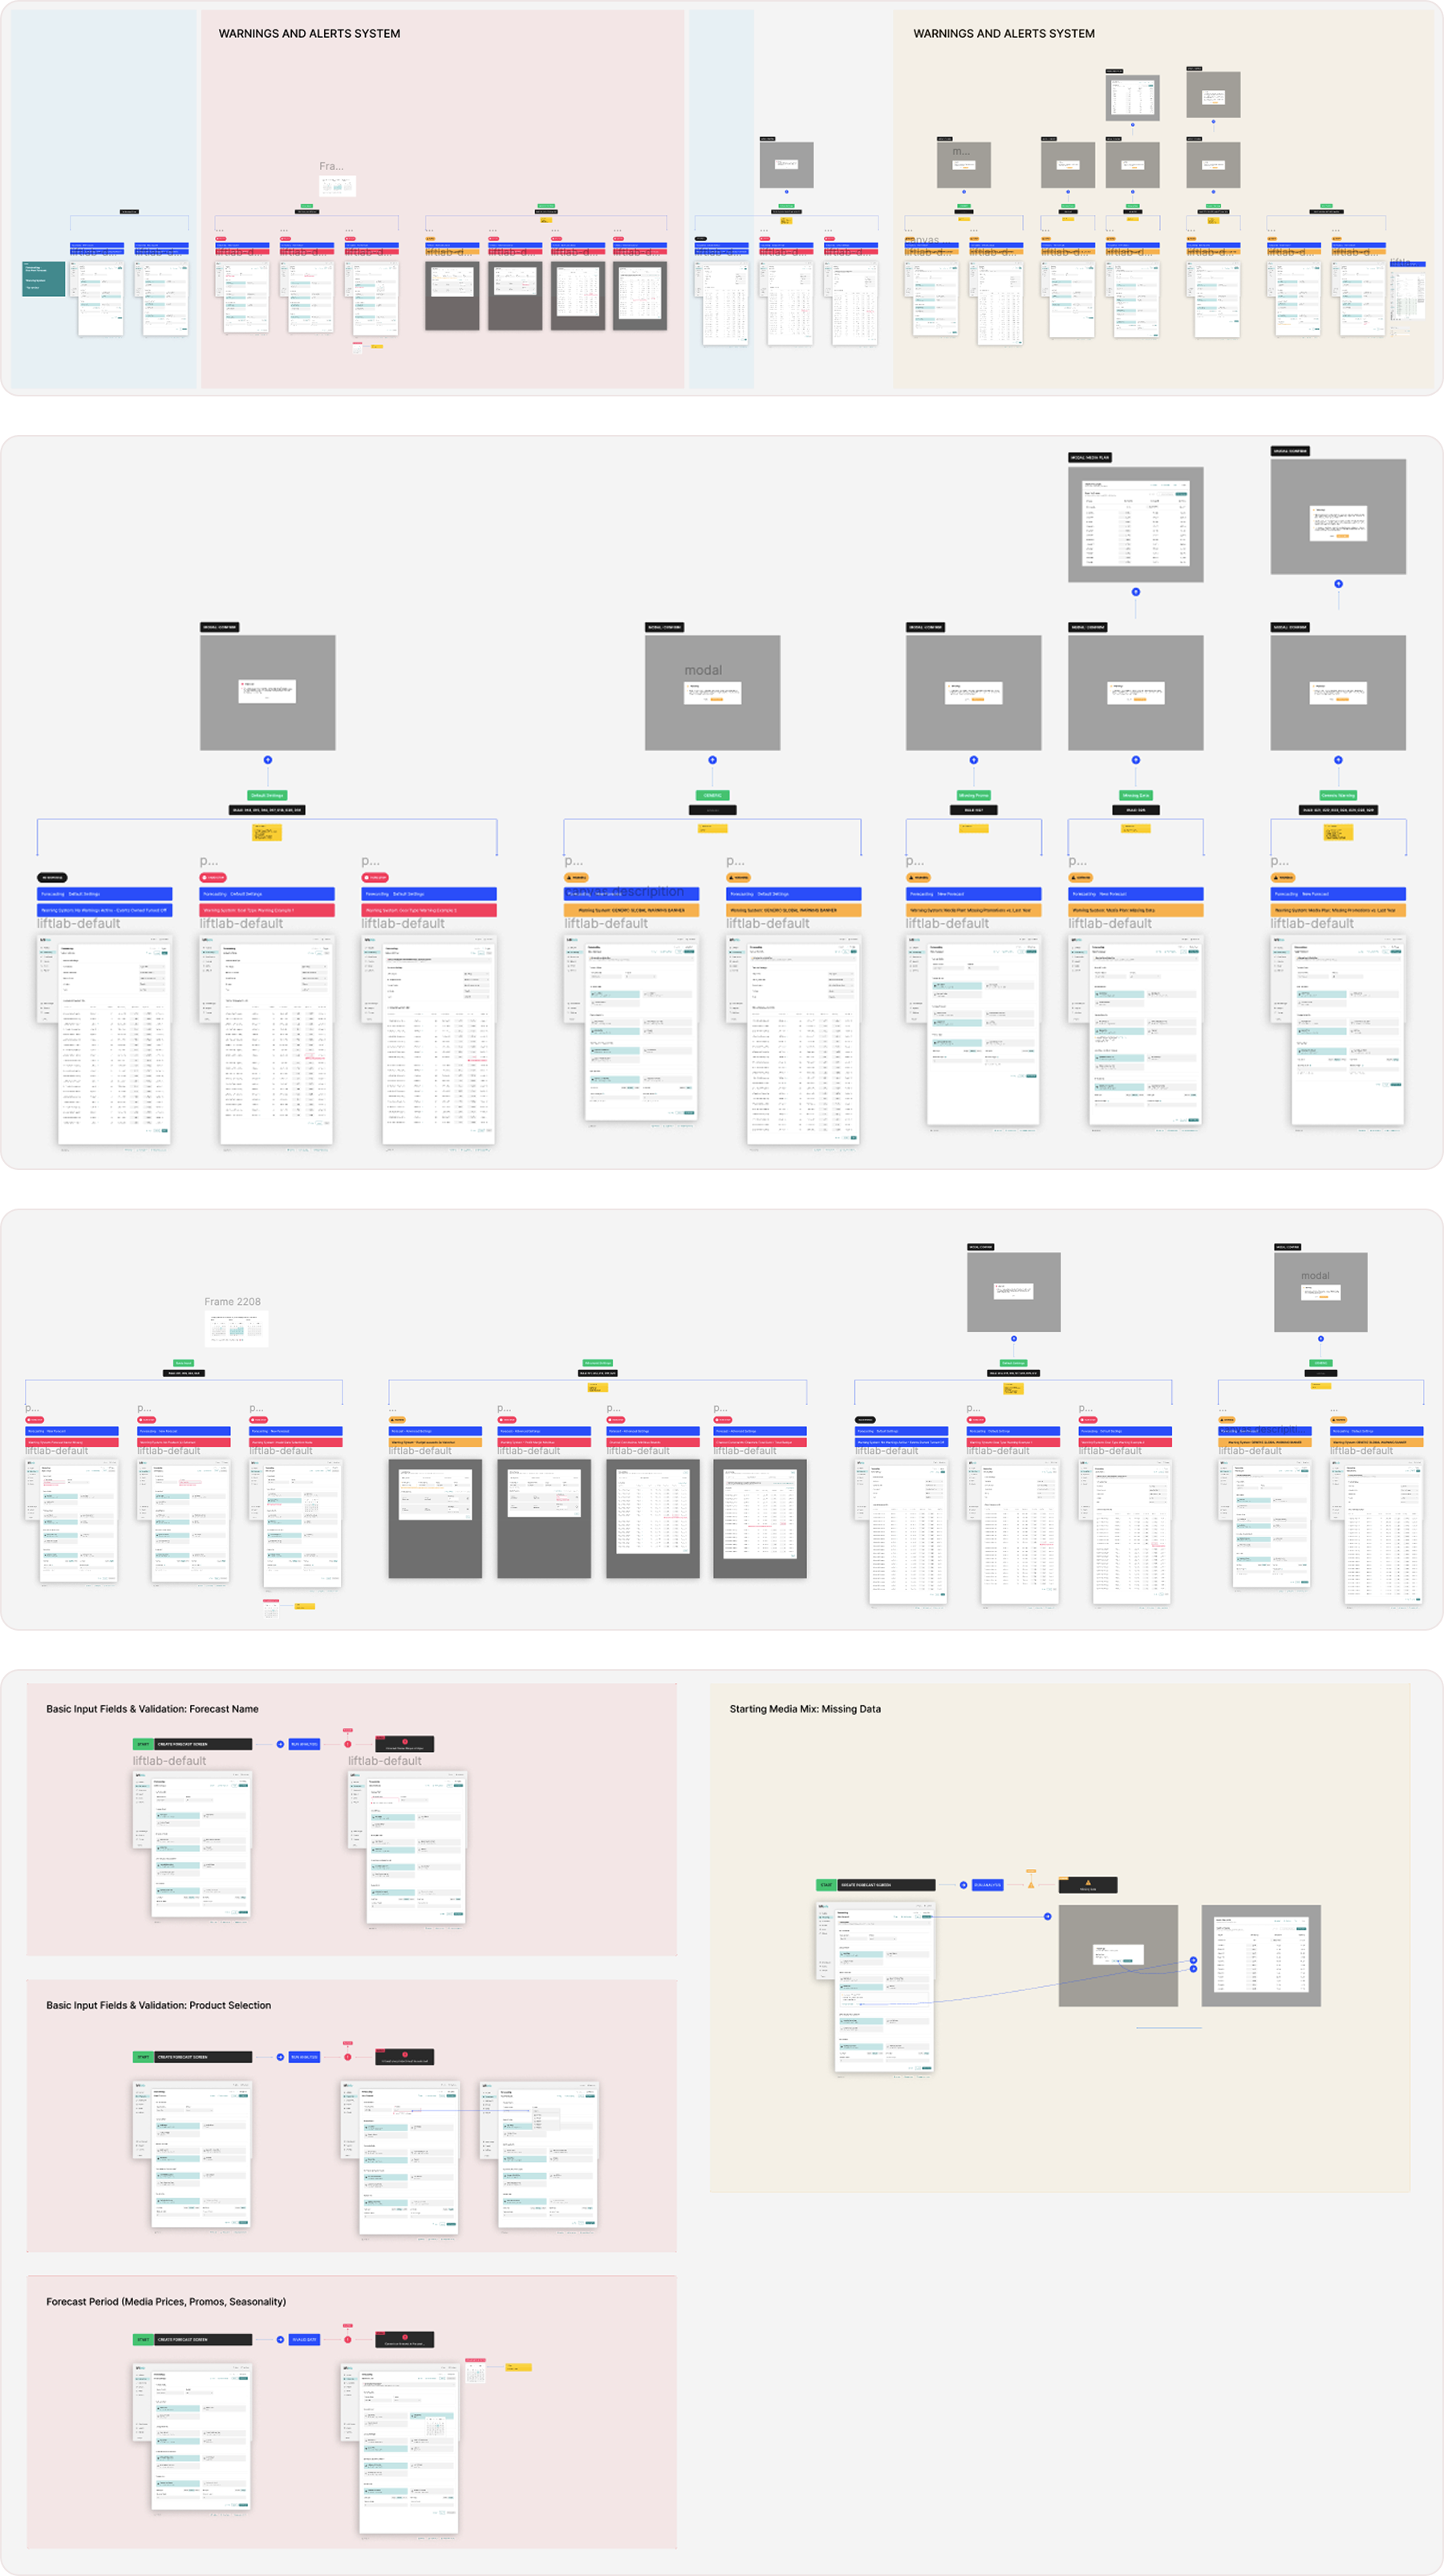
User Flows — Marketing Budget Managers
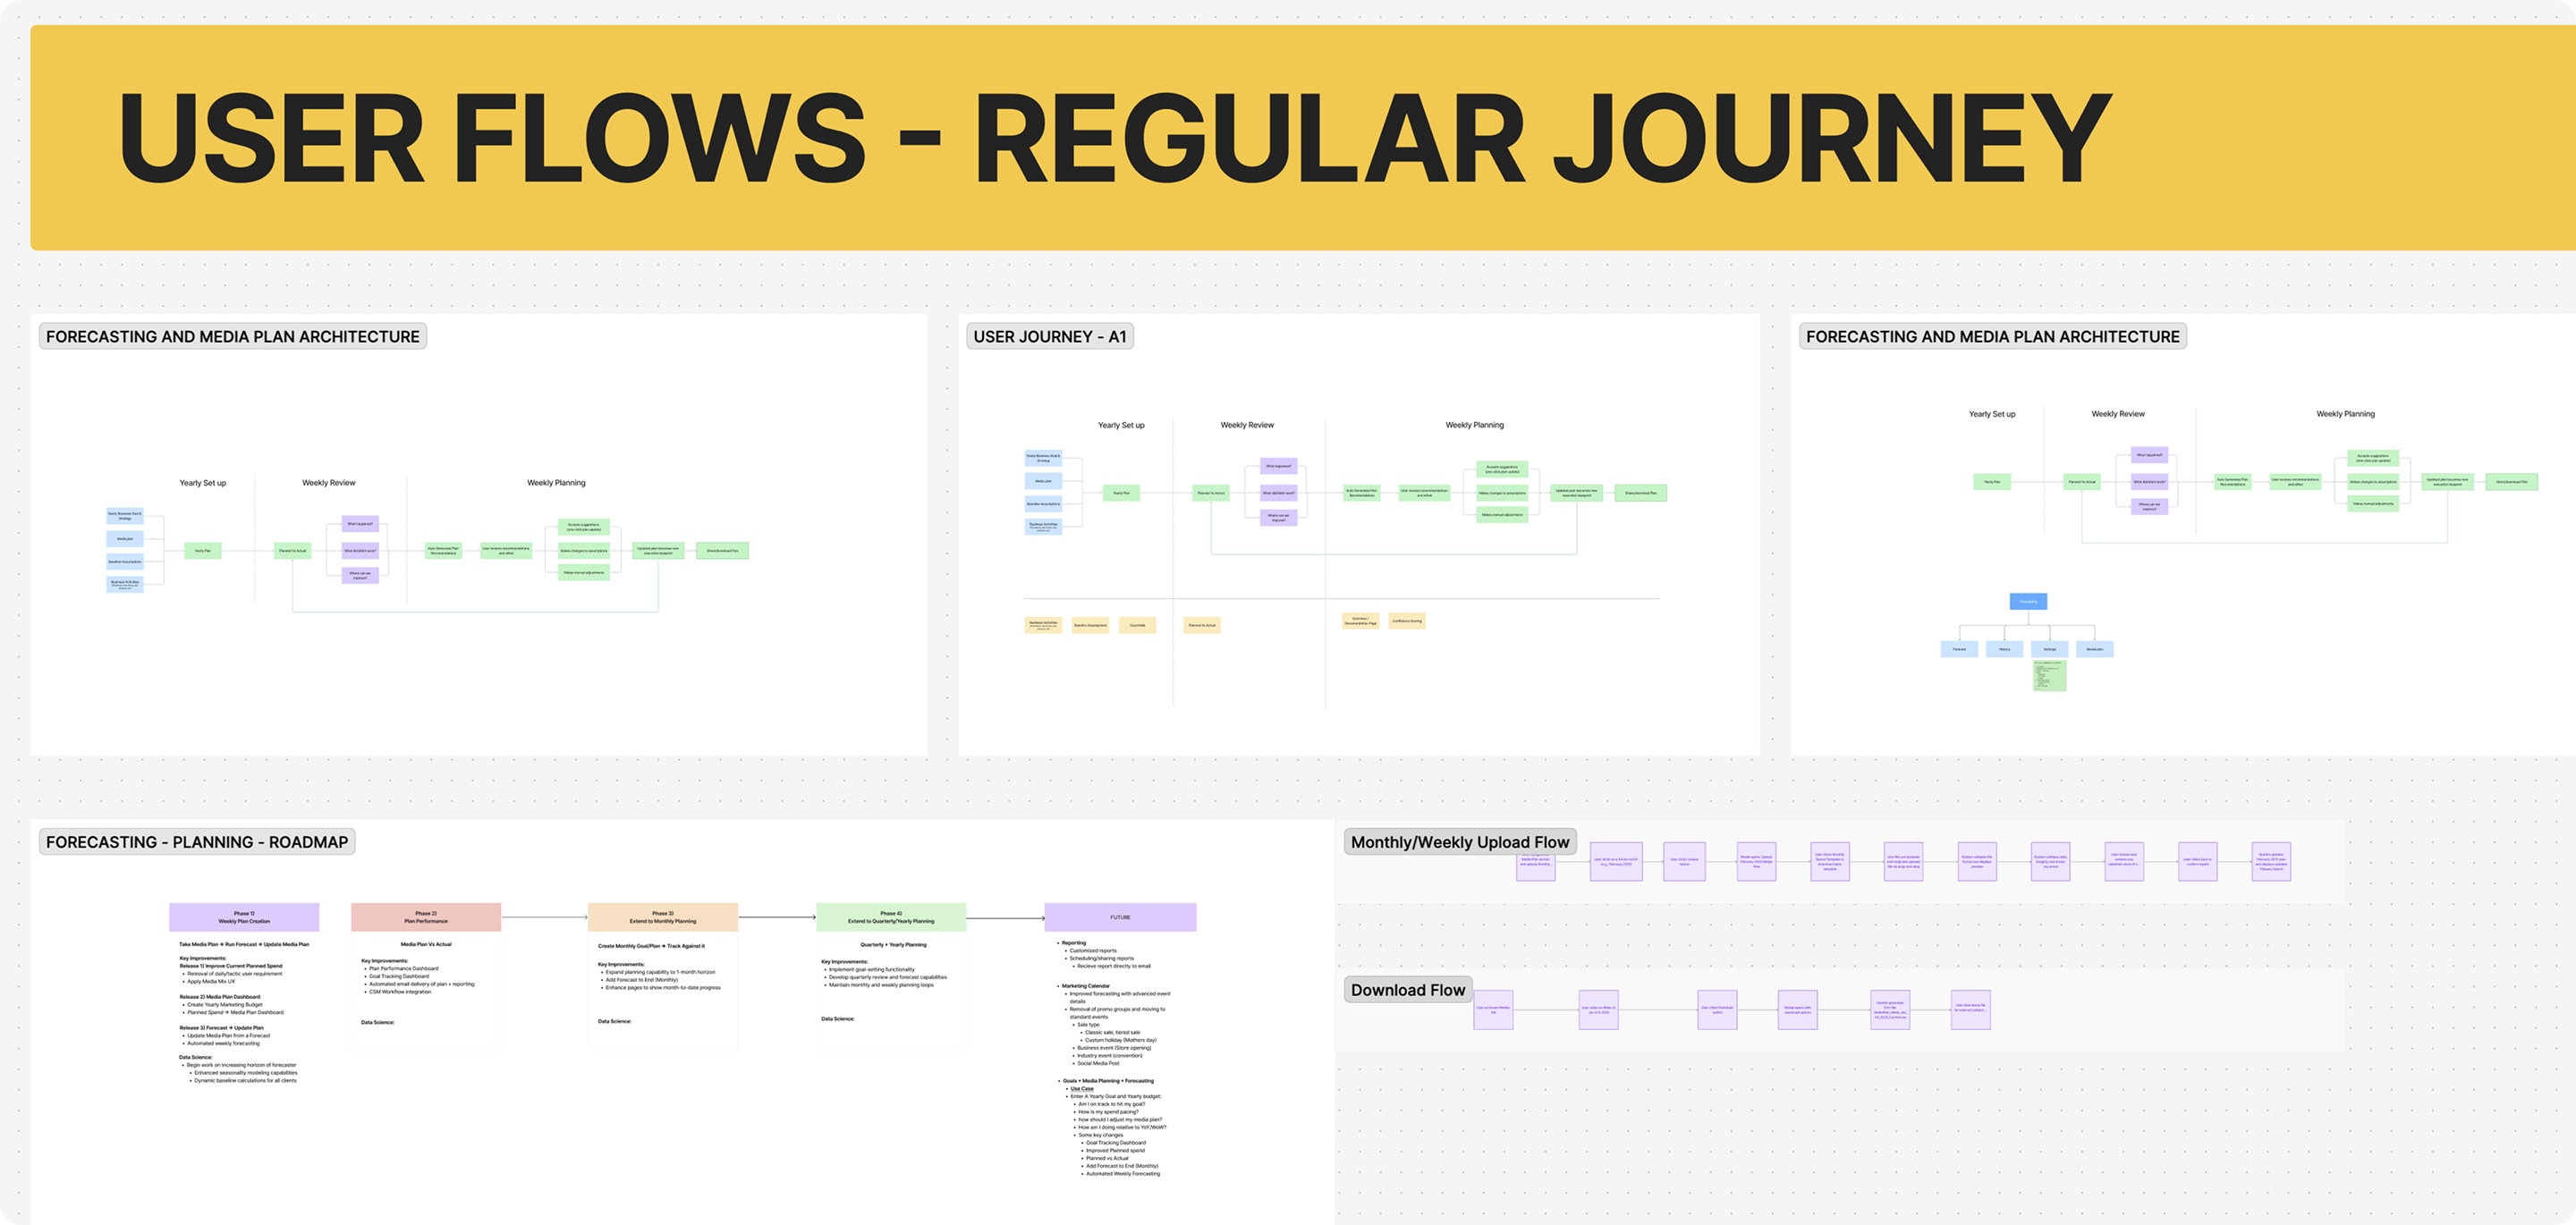
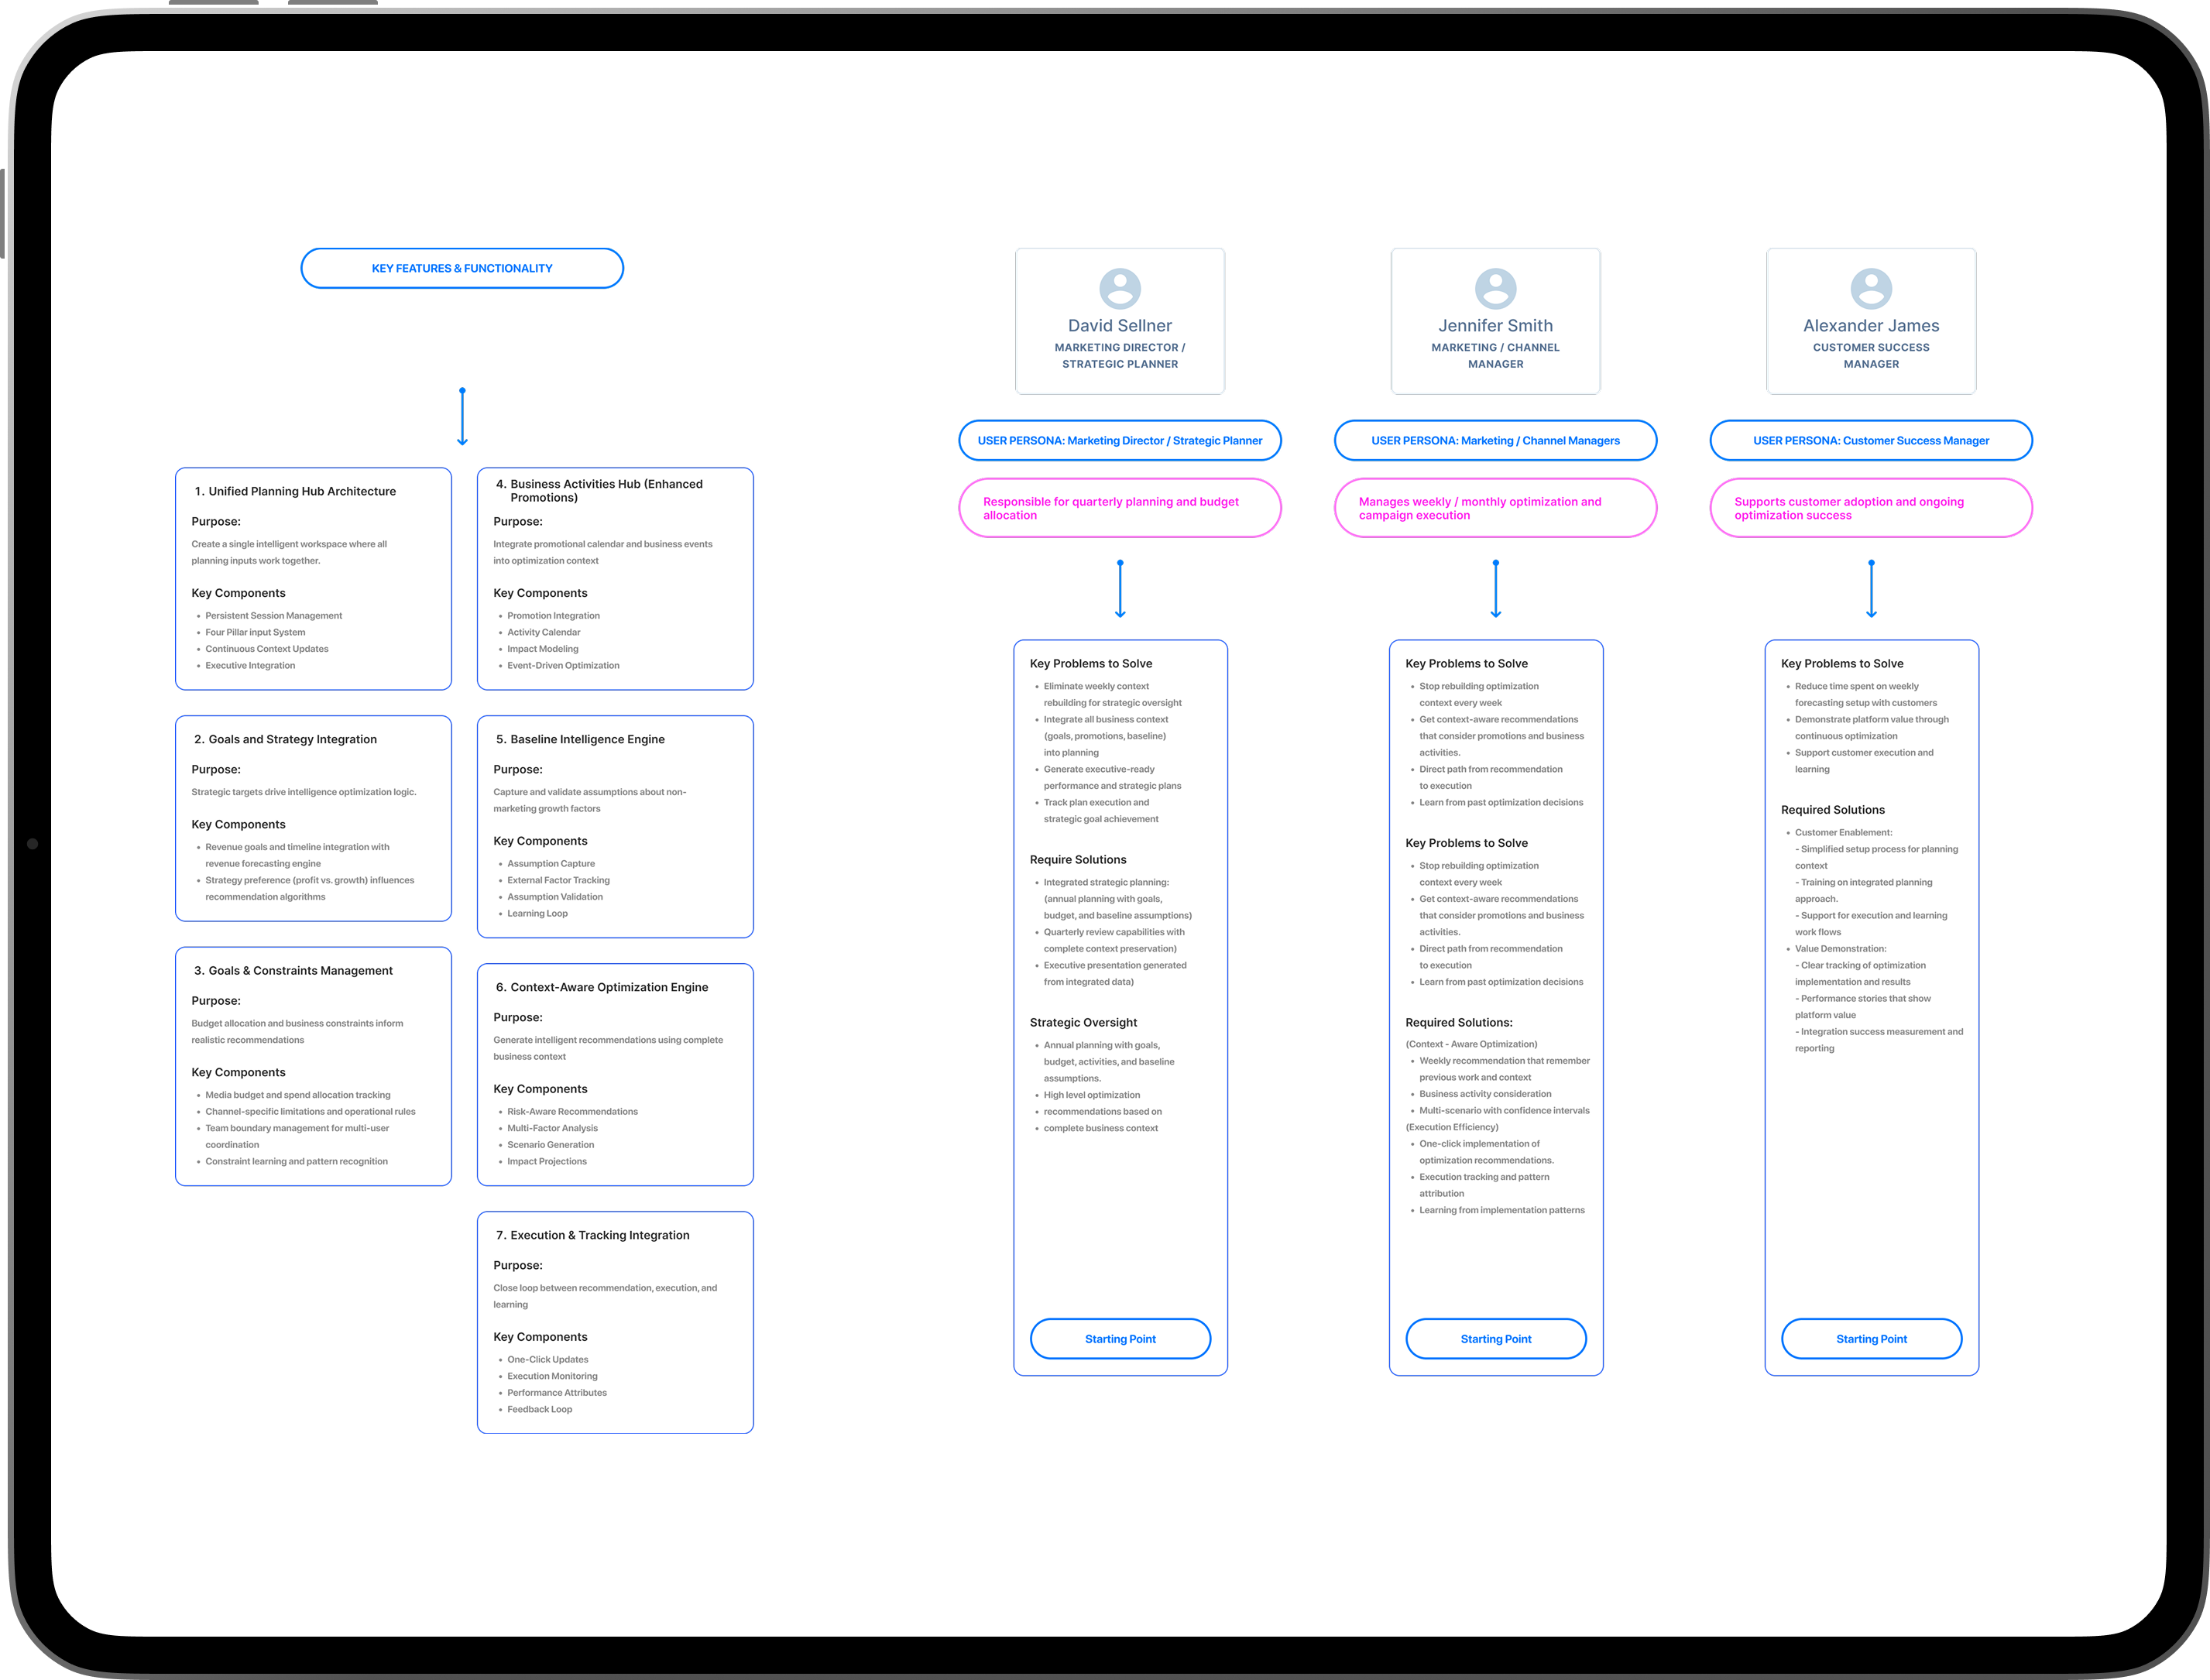
User Flows — Budget Leads and Directors
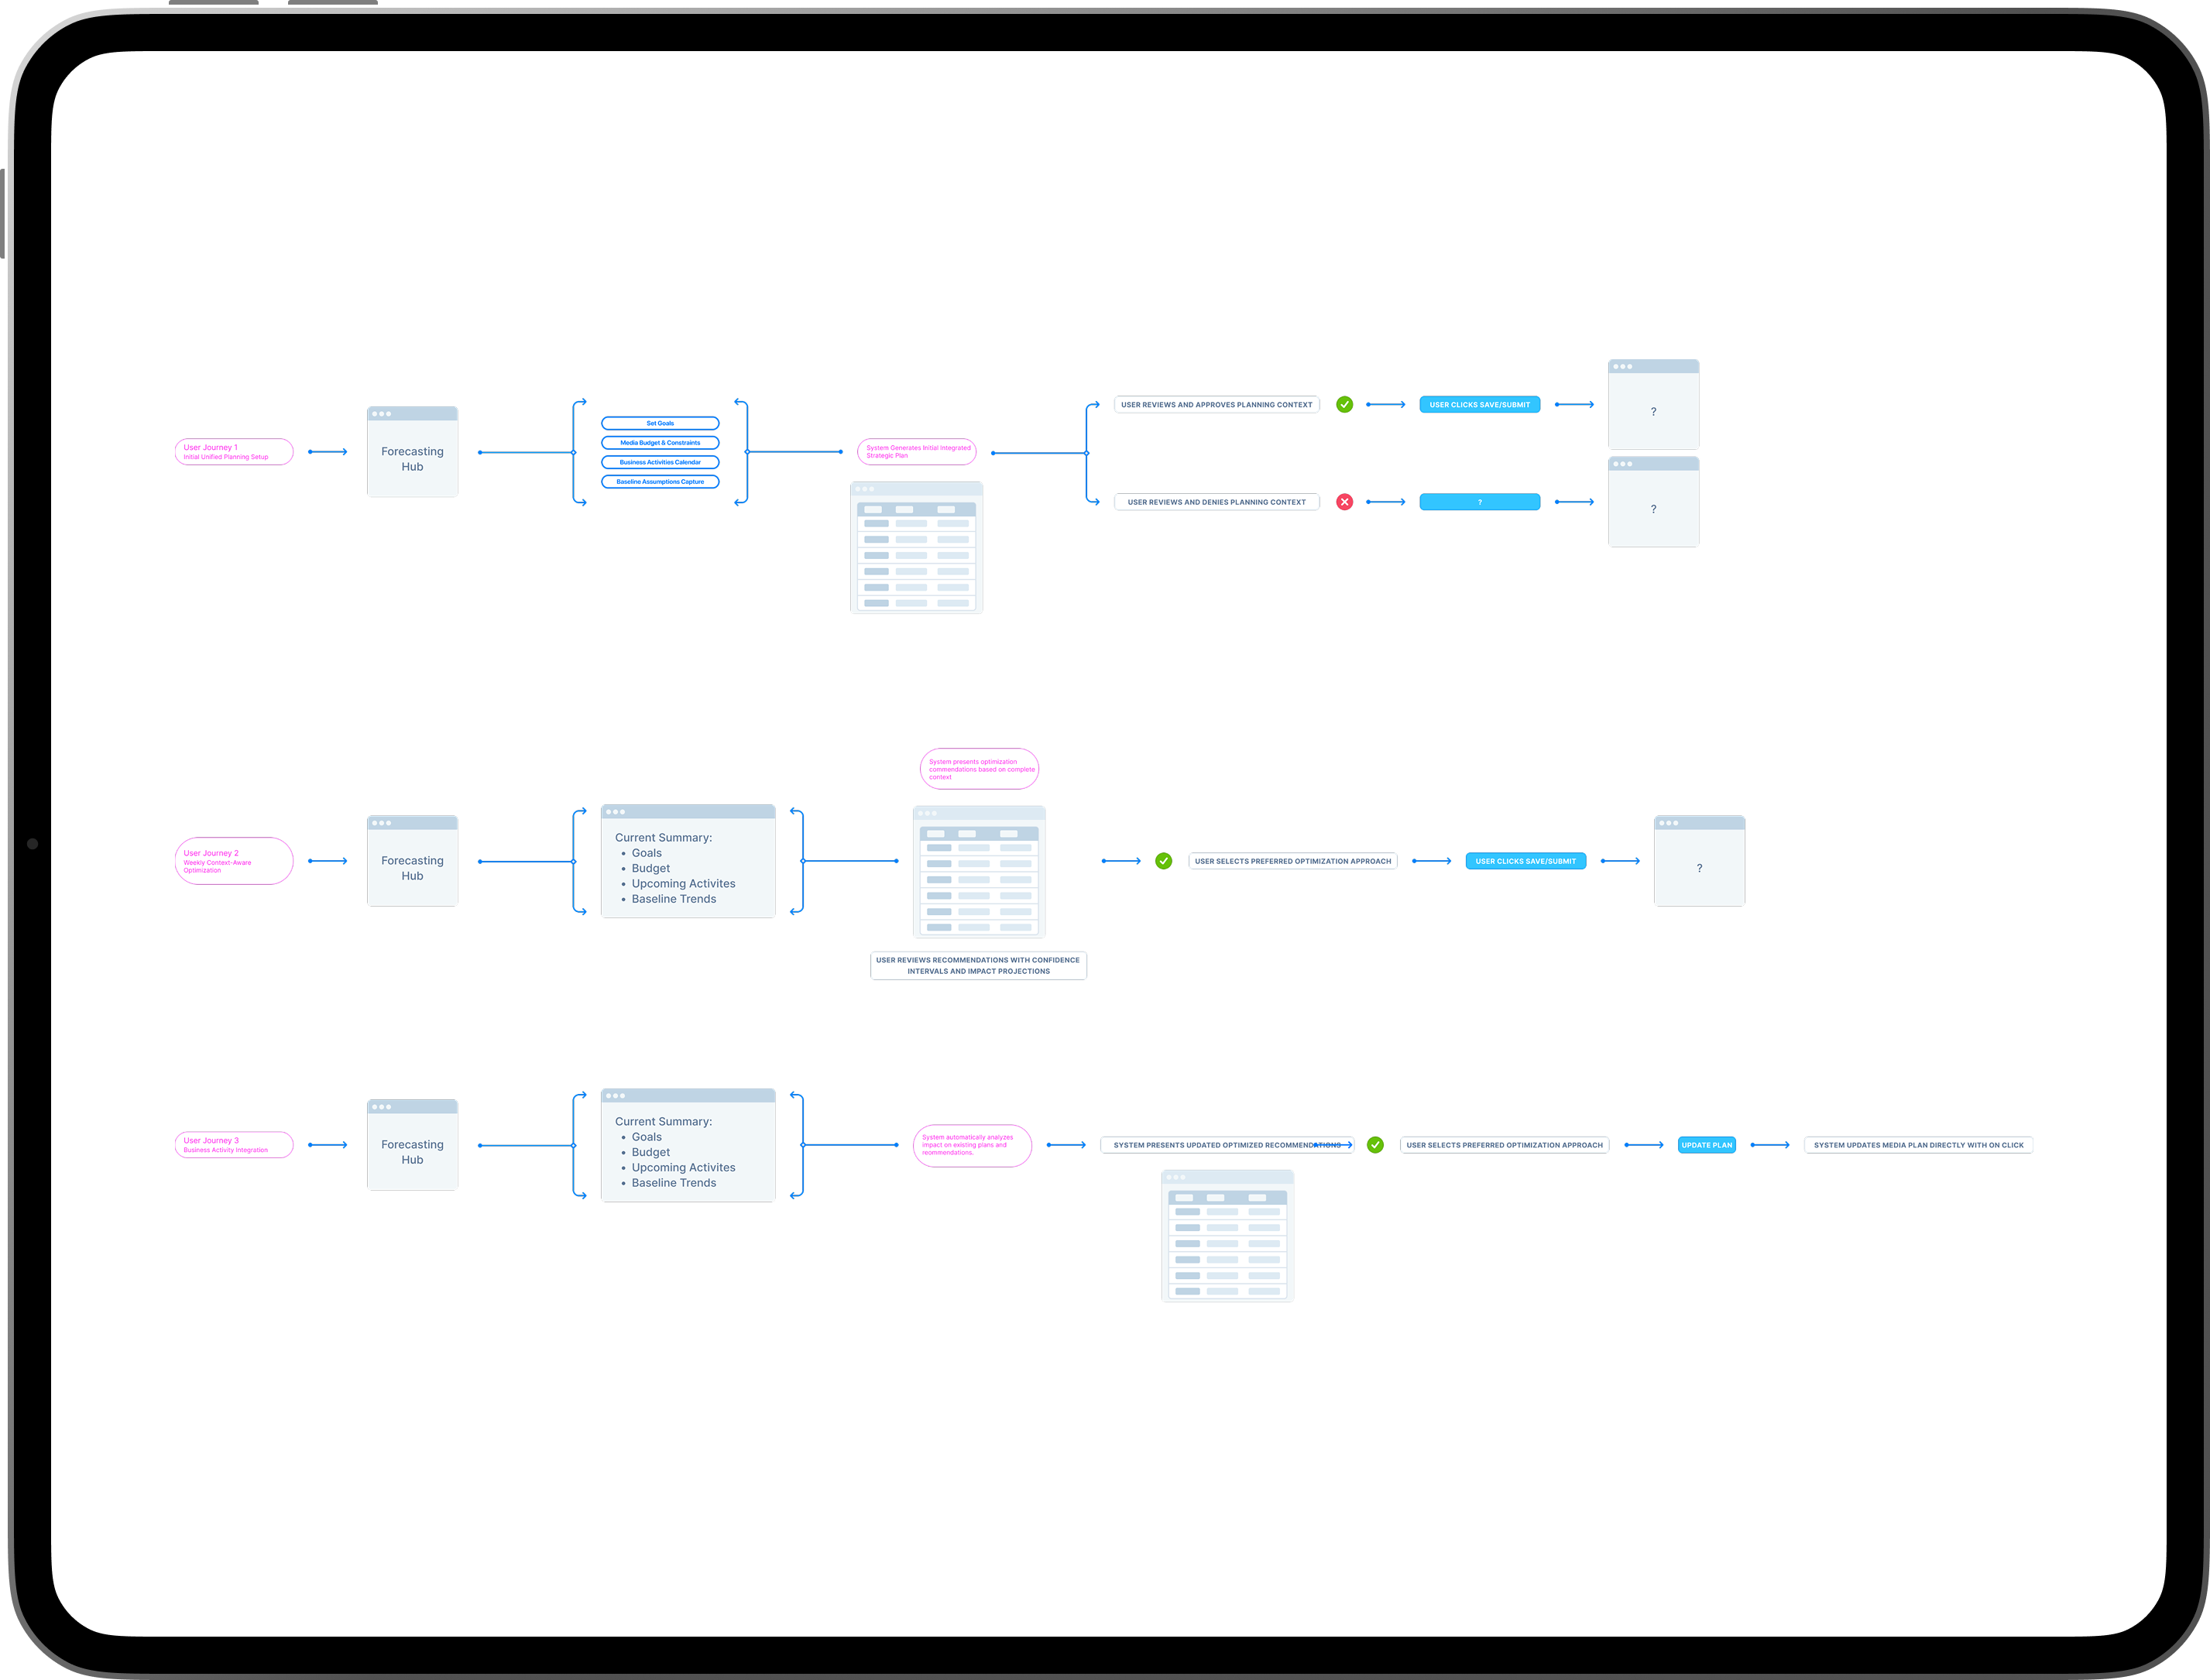
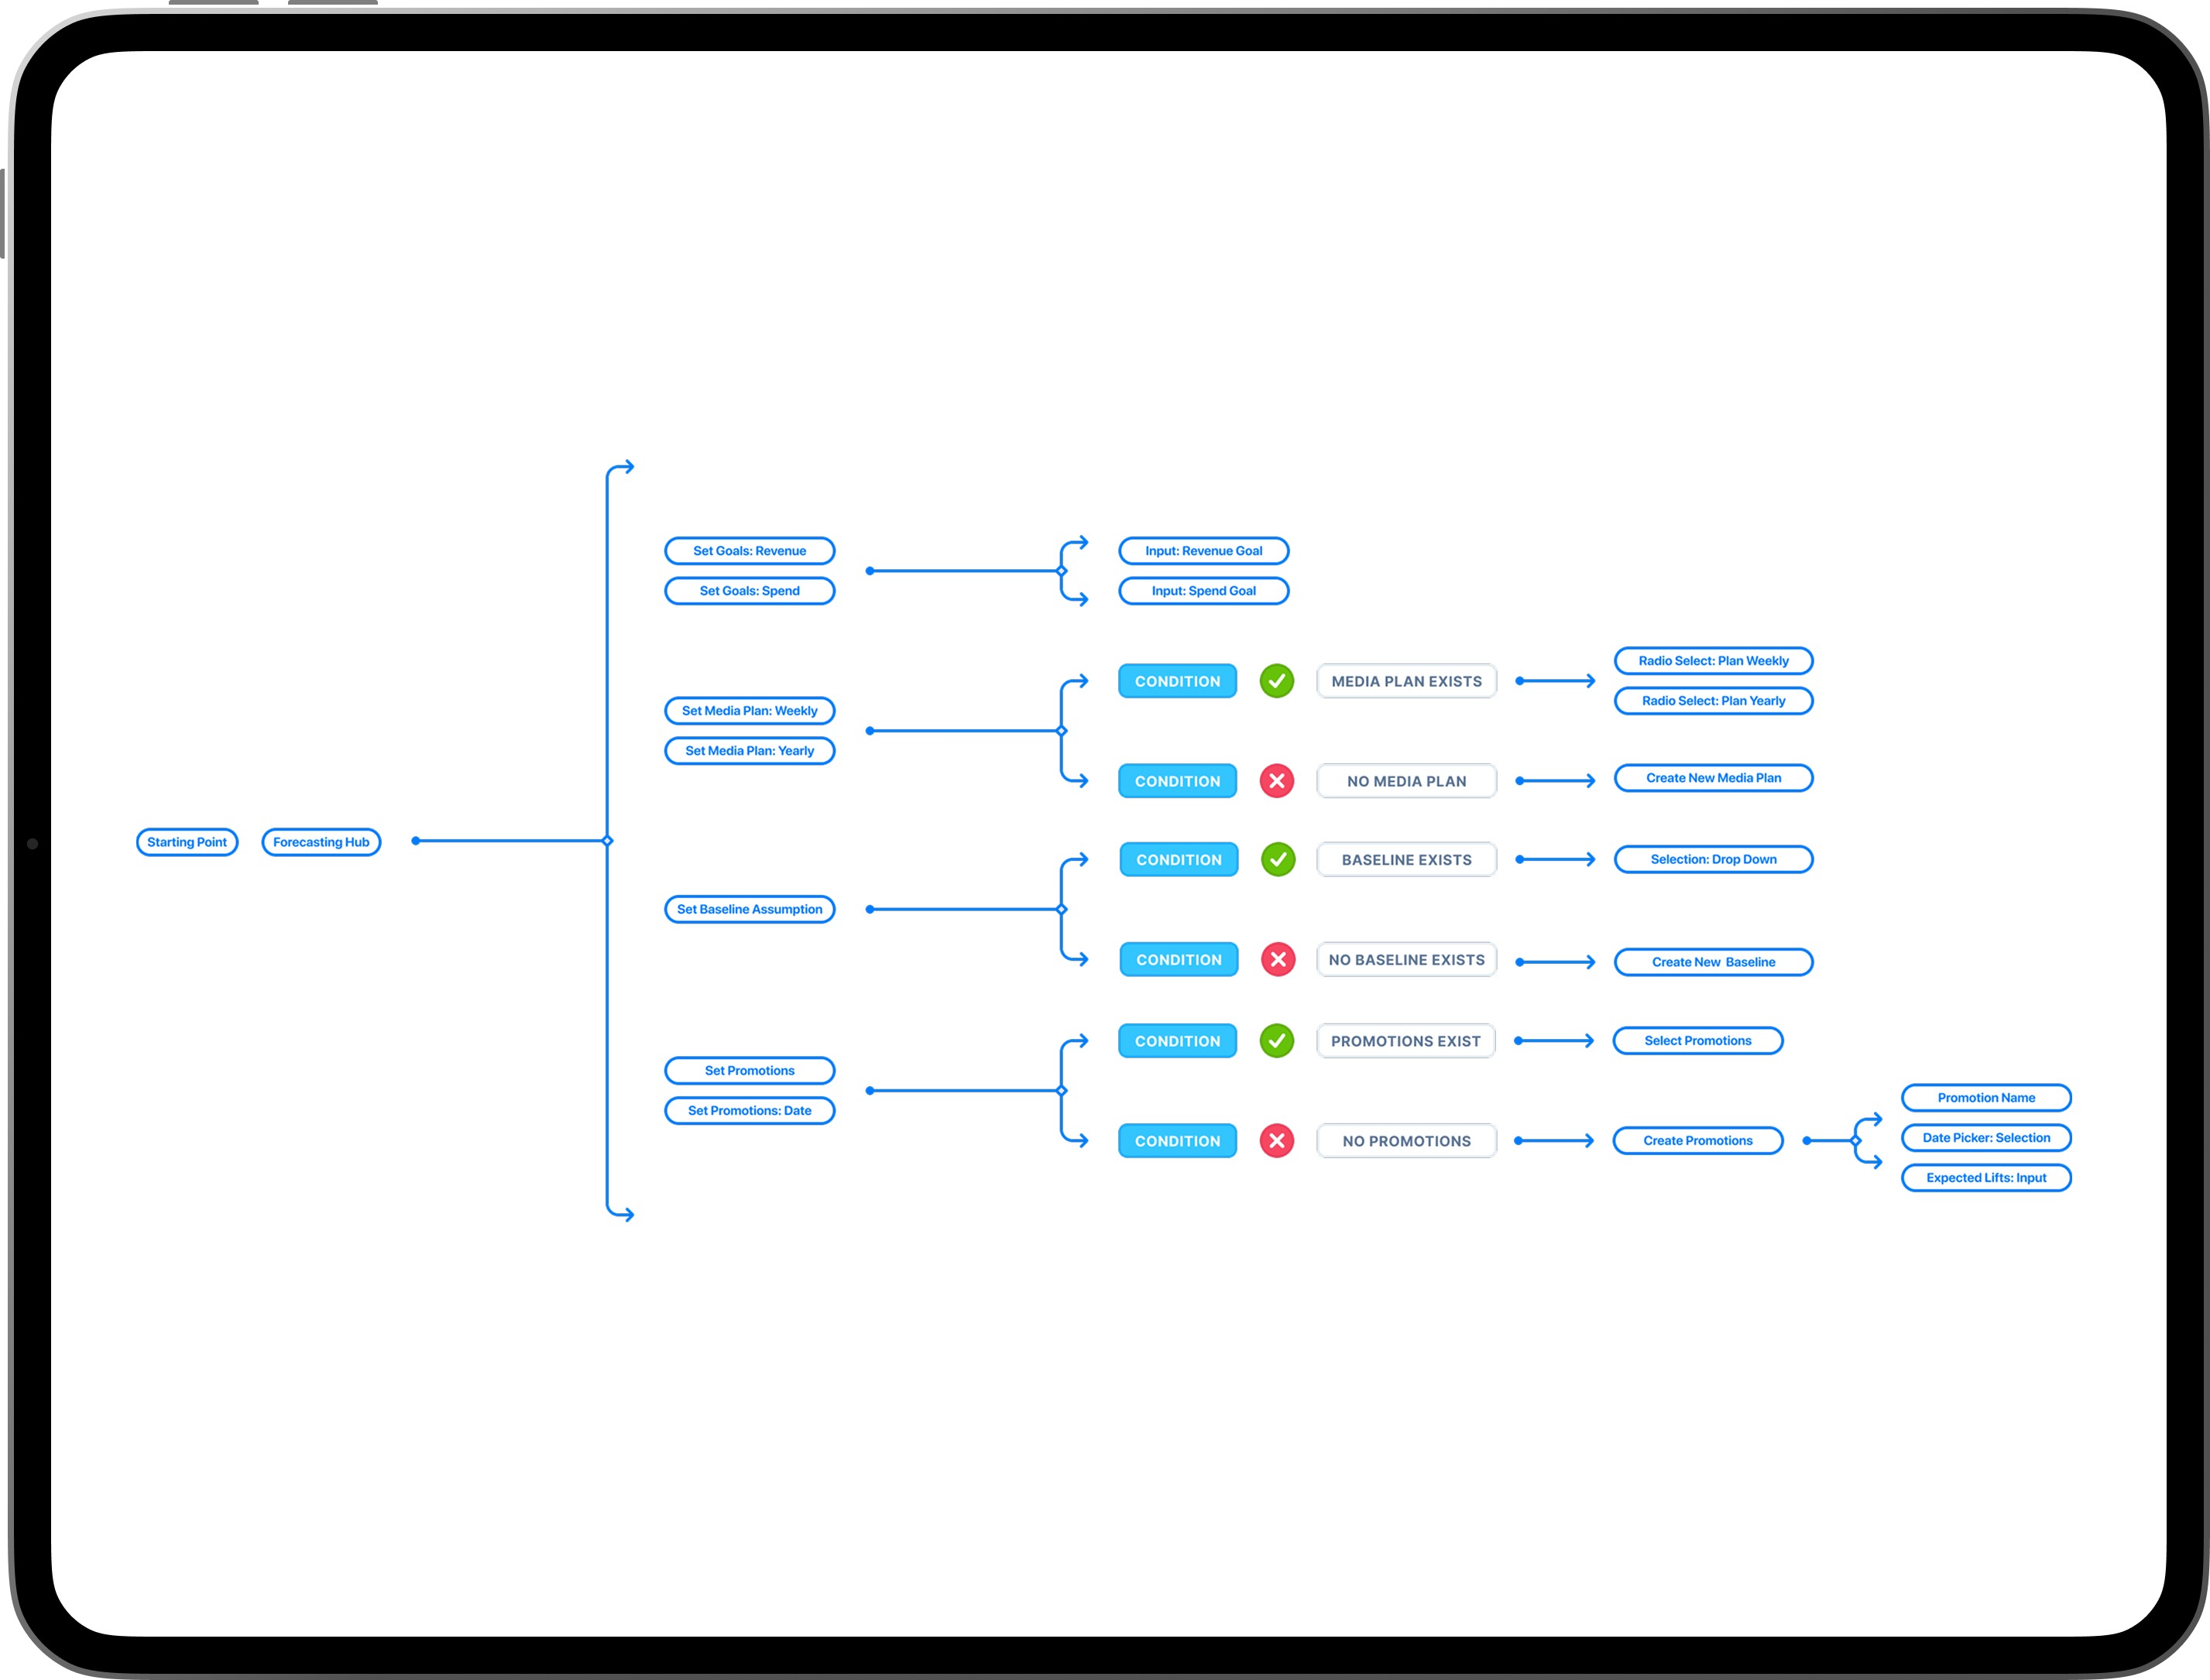
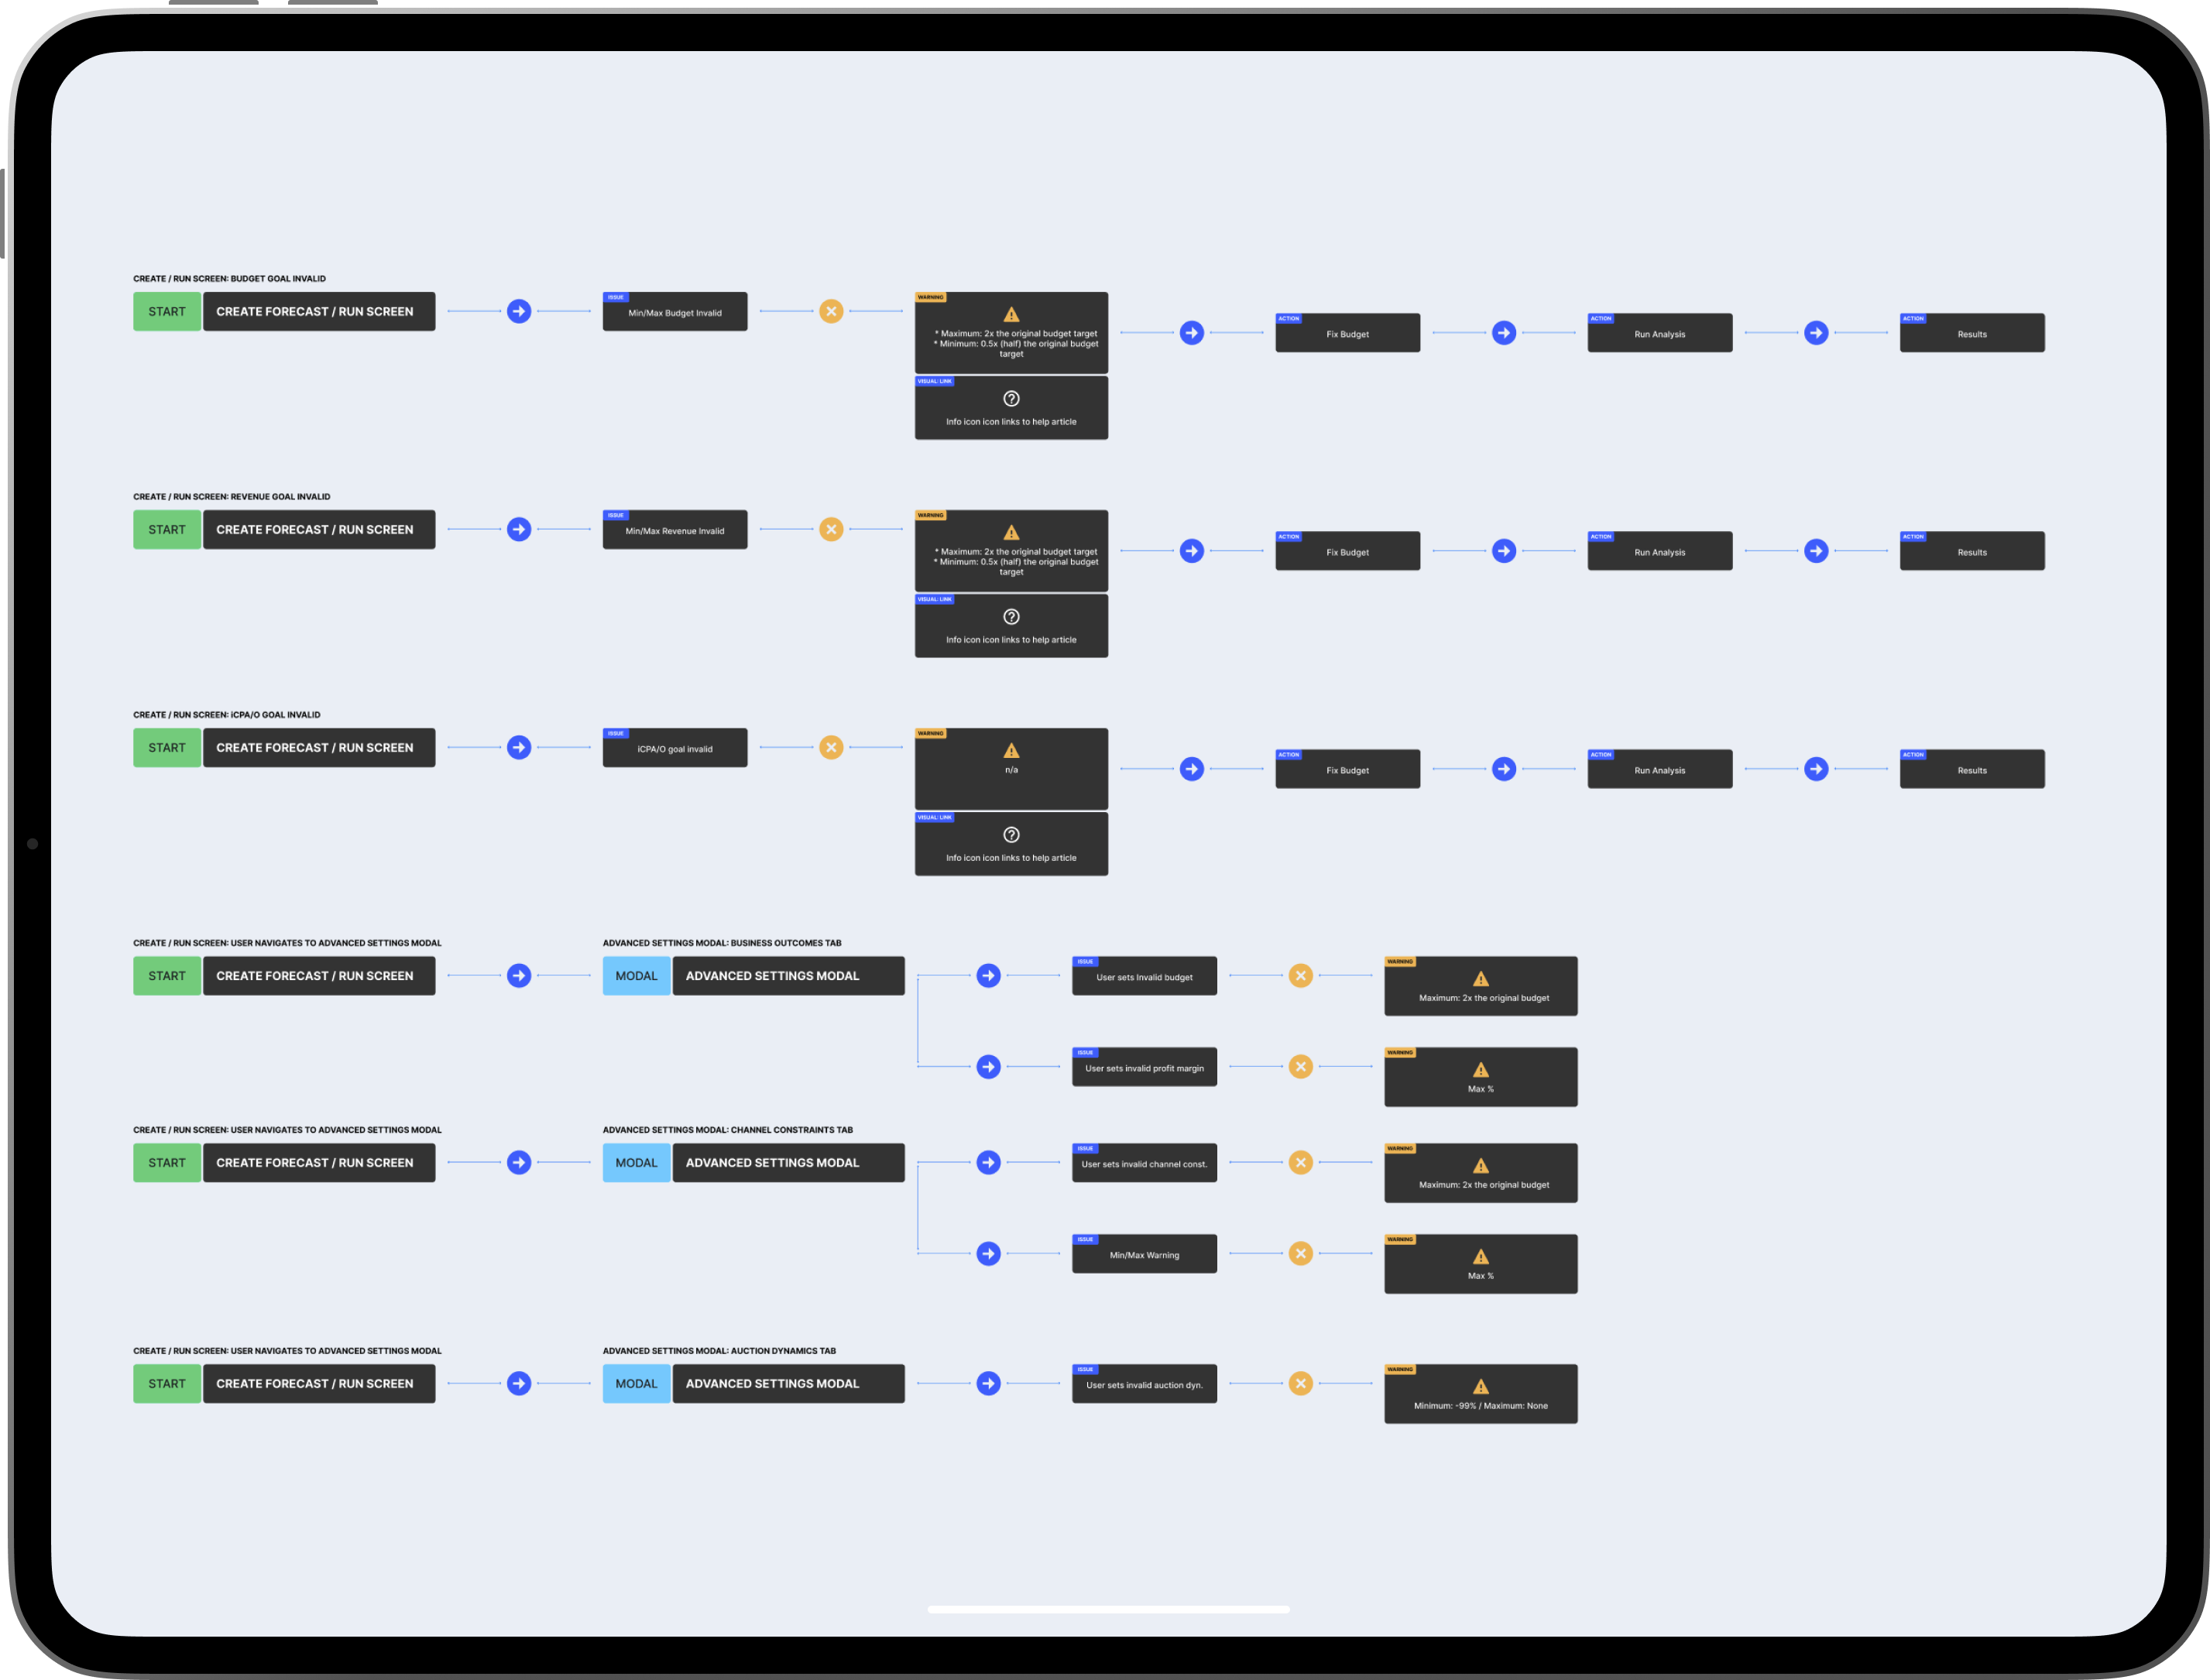
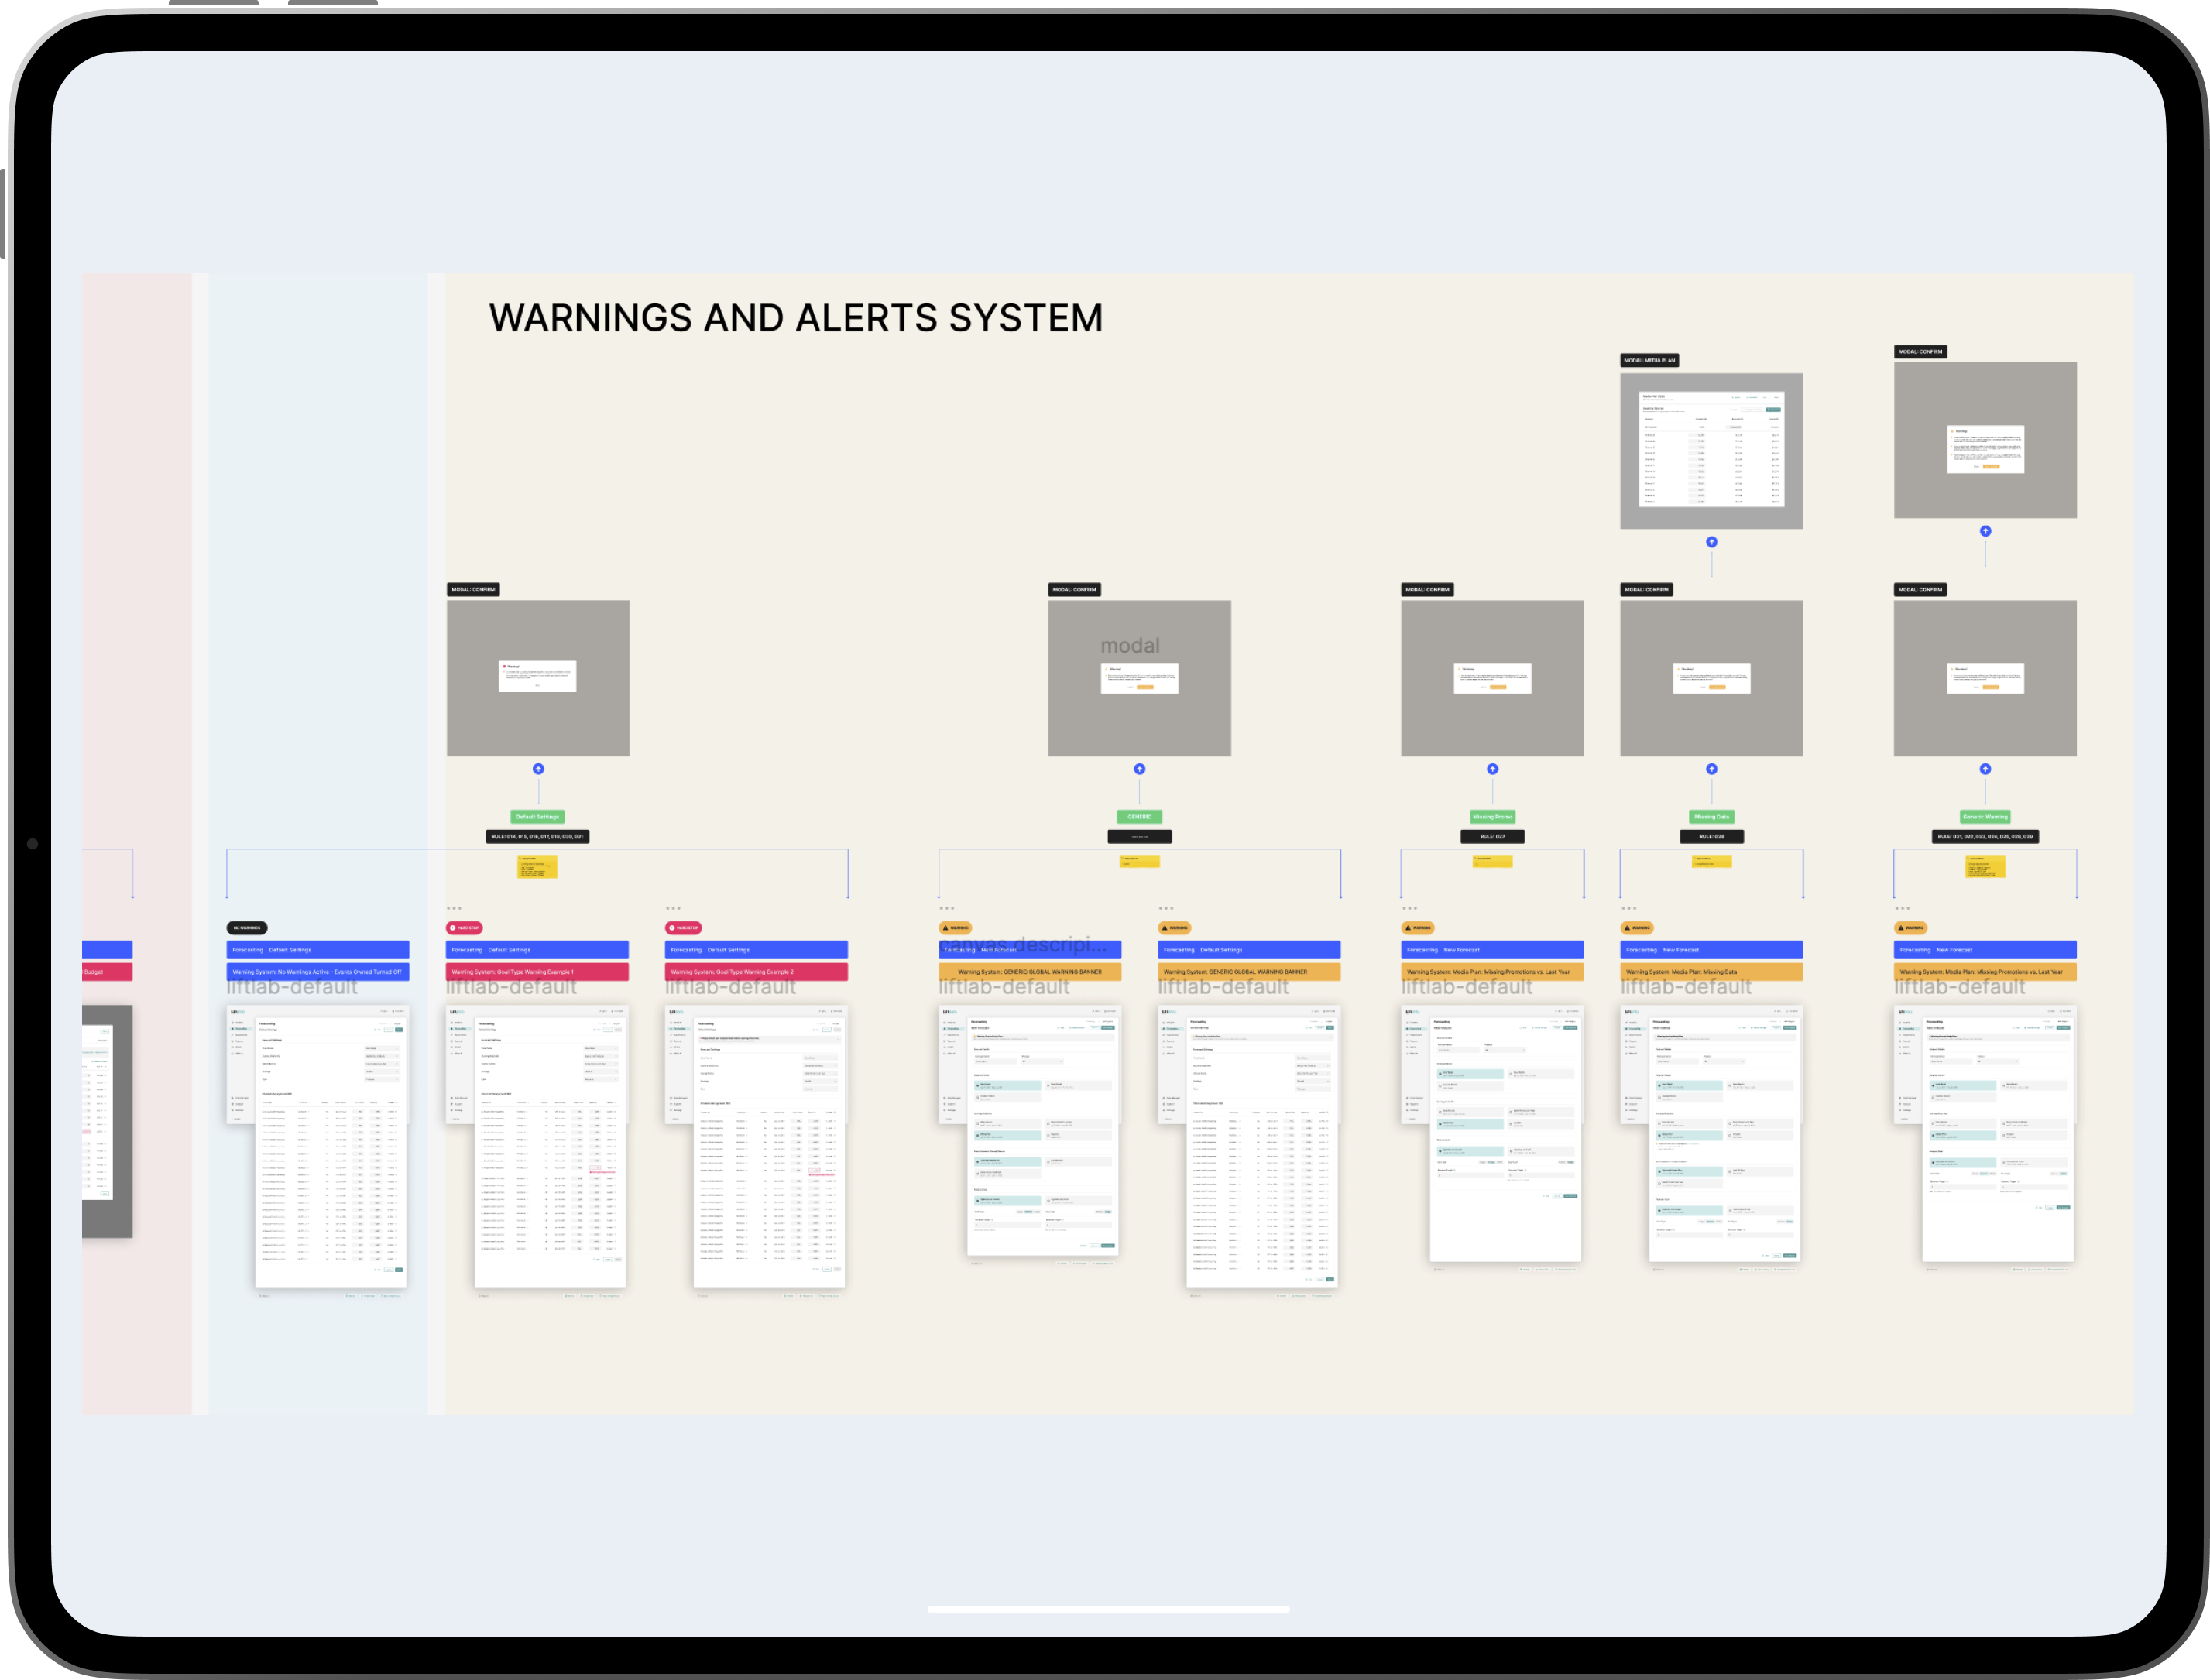
User Testing — Alerts Flow
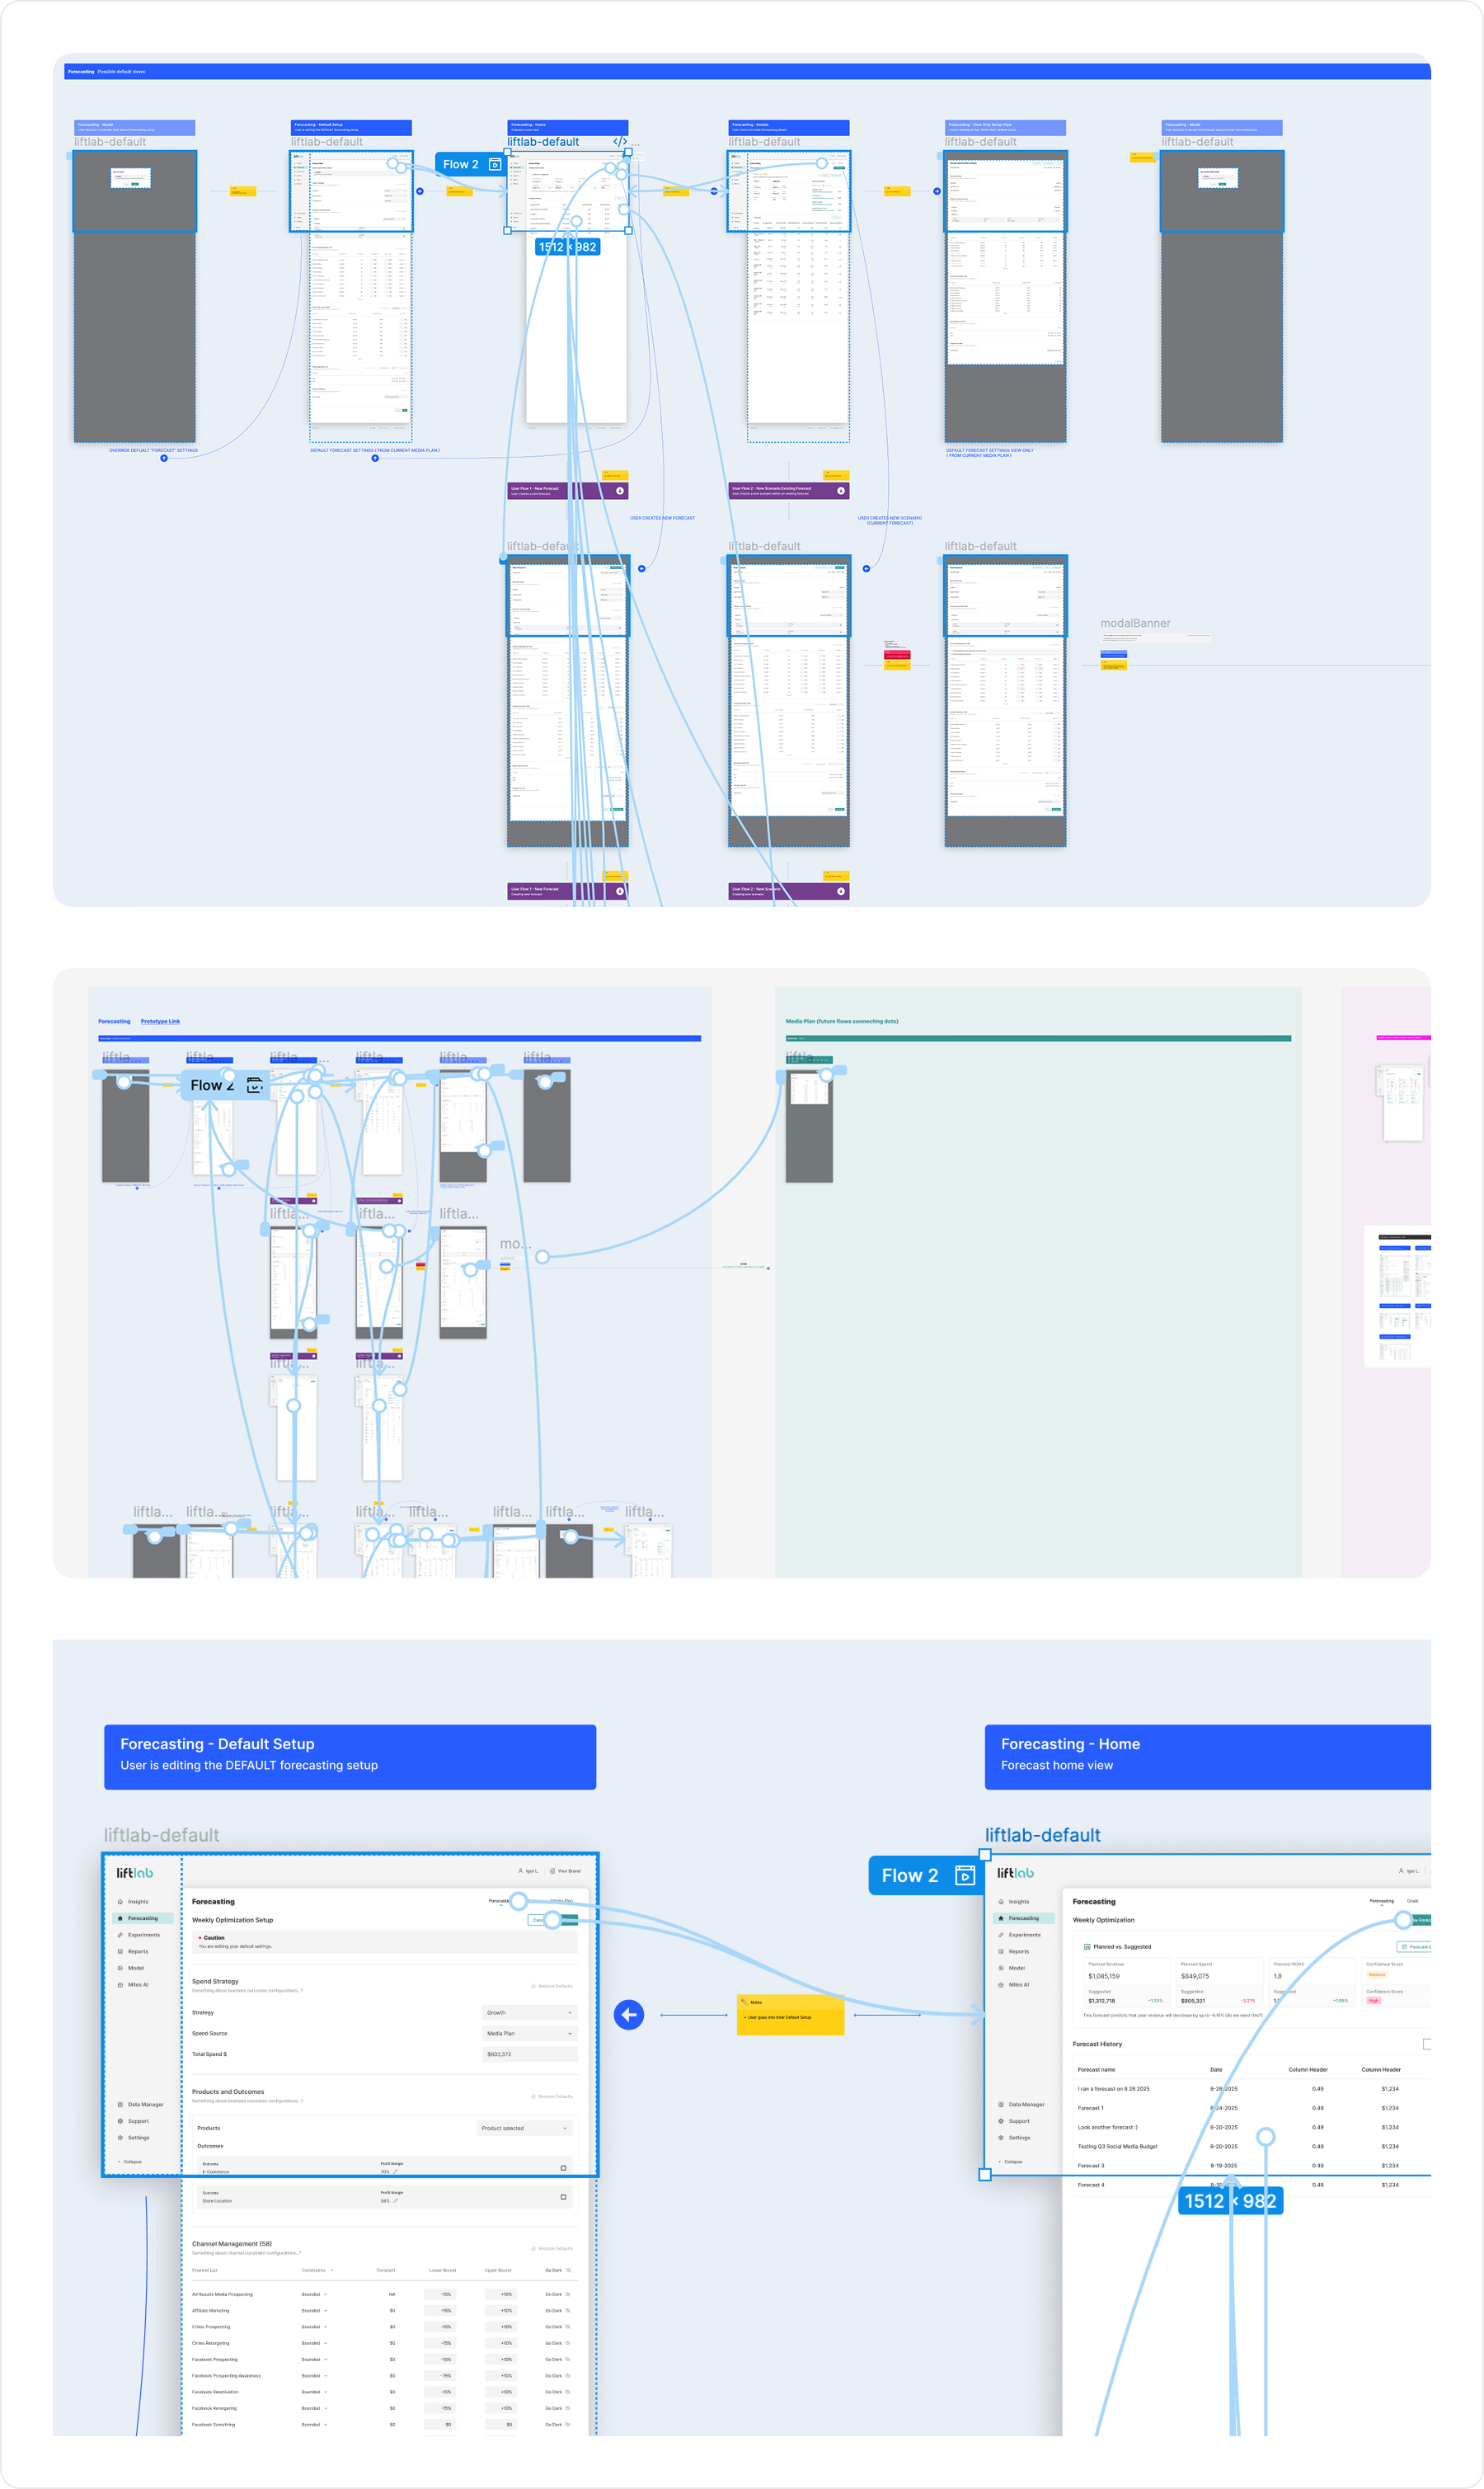
User Testing and Prototyping
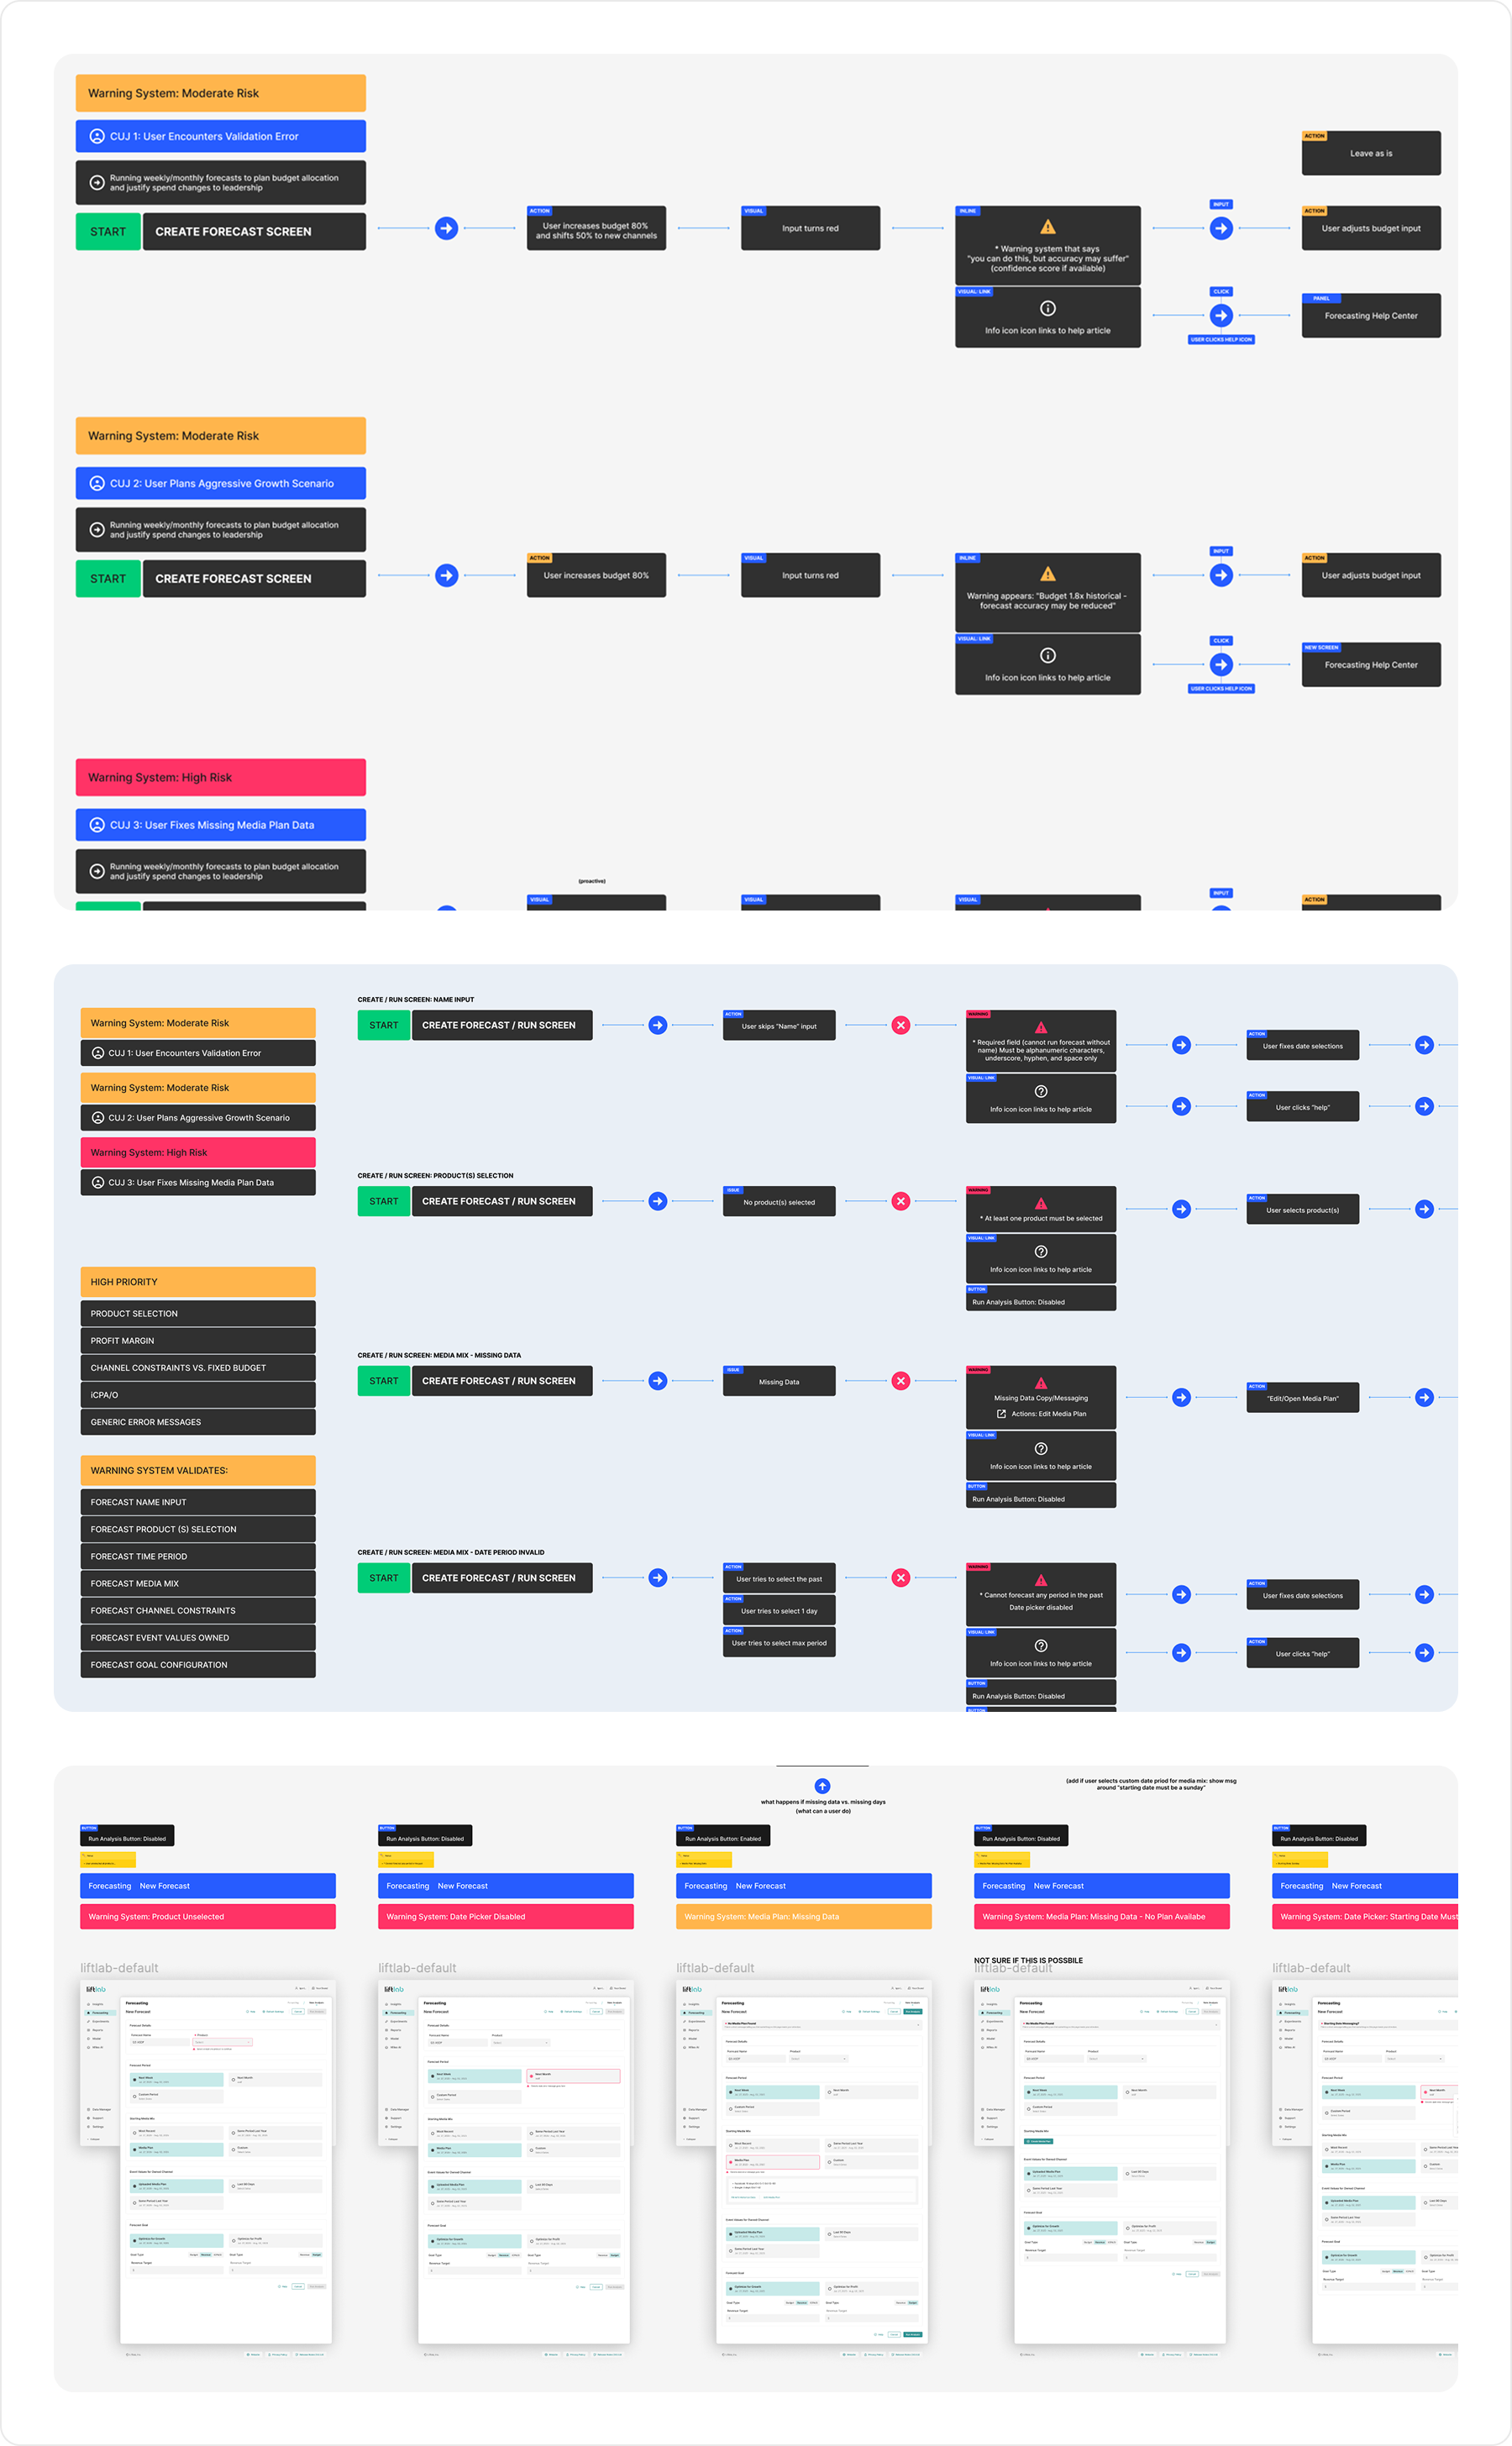
User Flows and Warning Systems
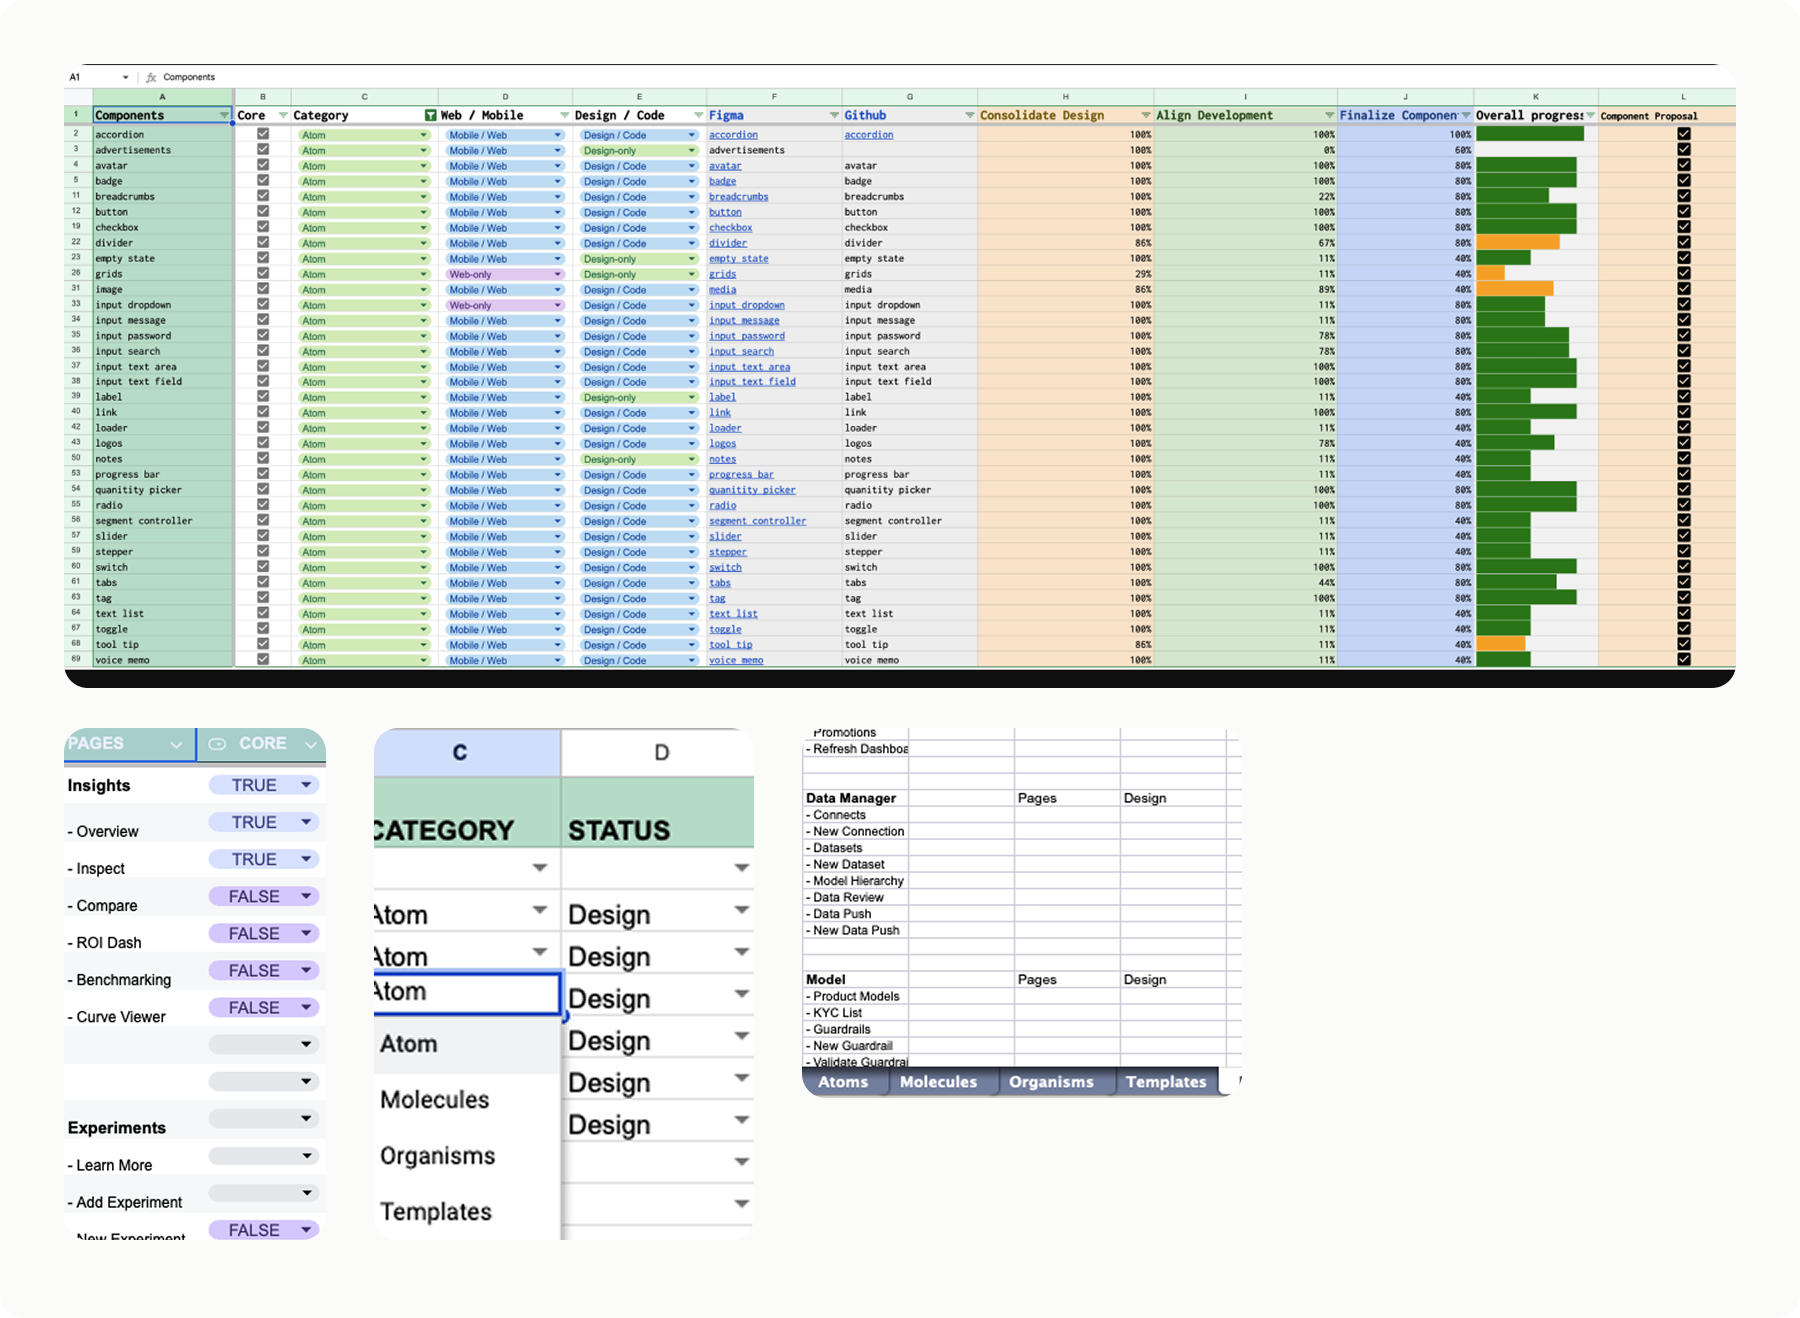
Design System Documentation
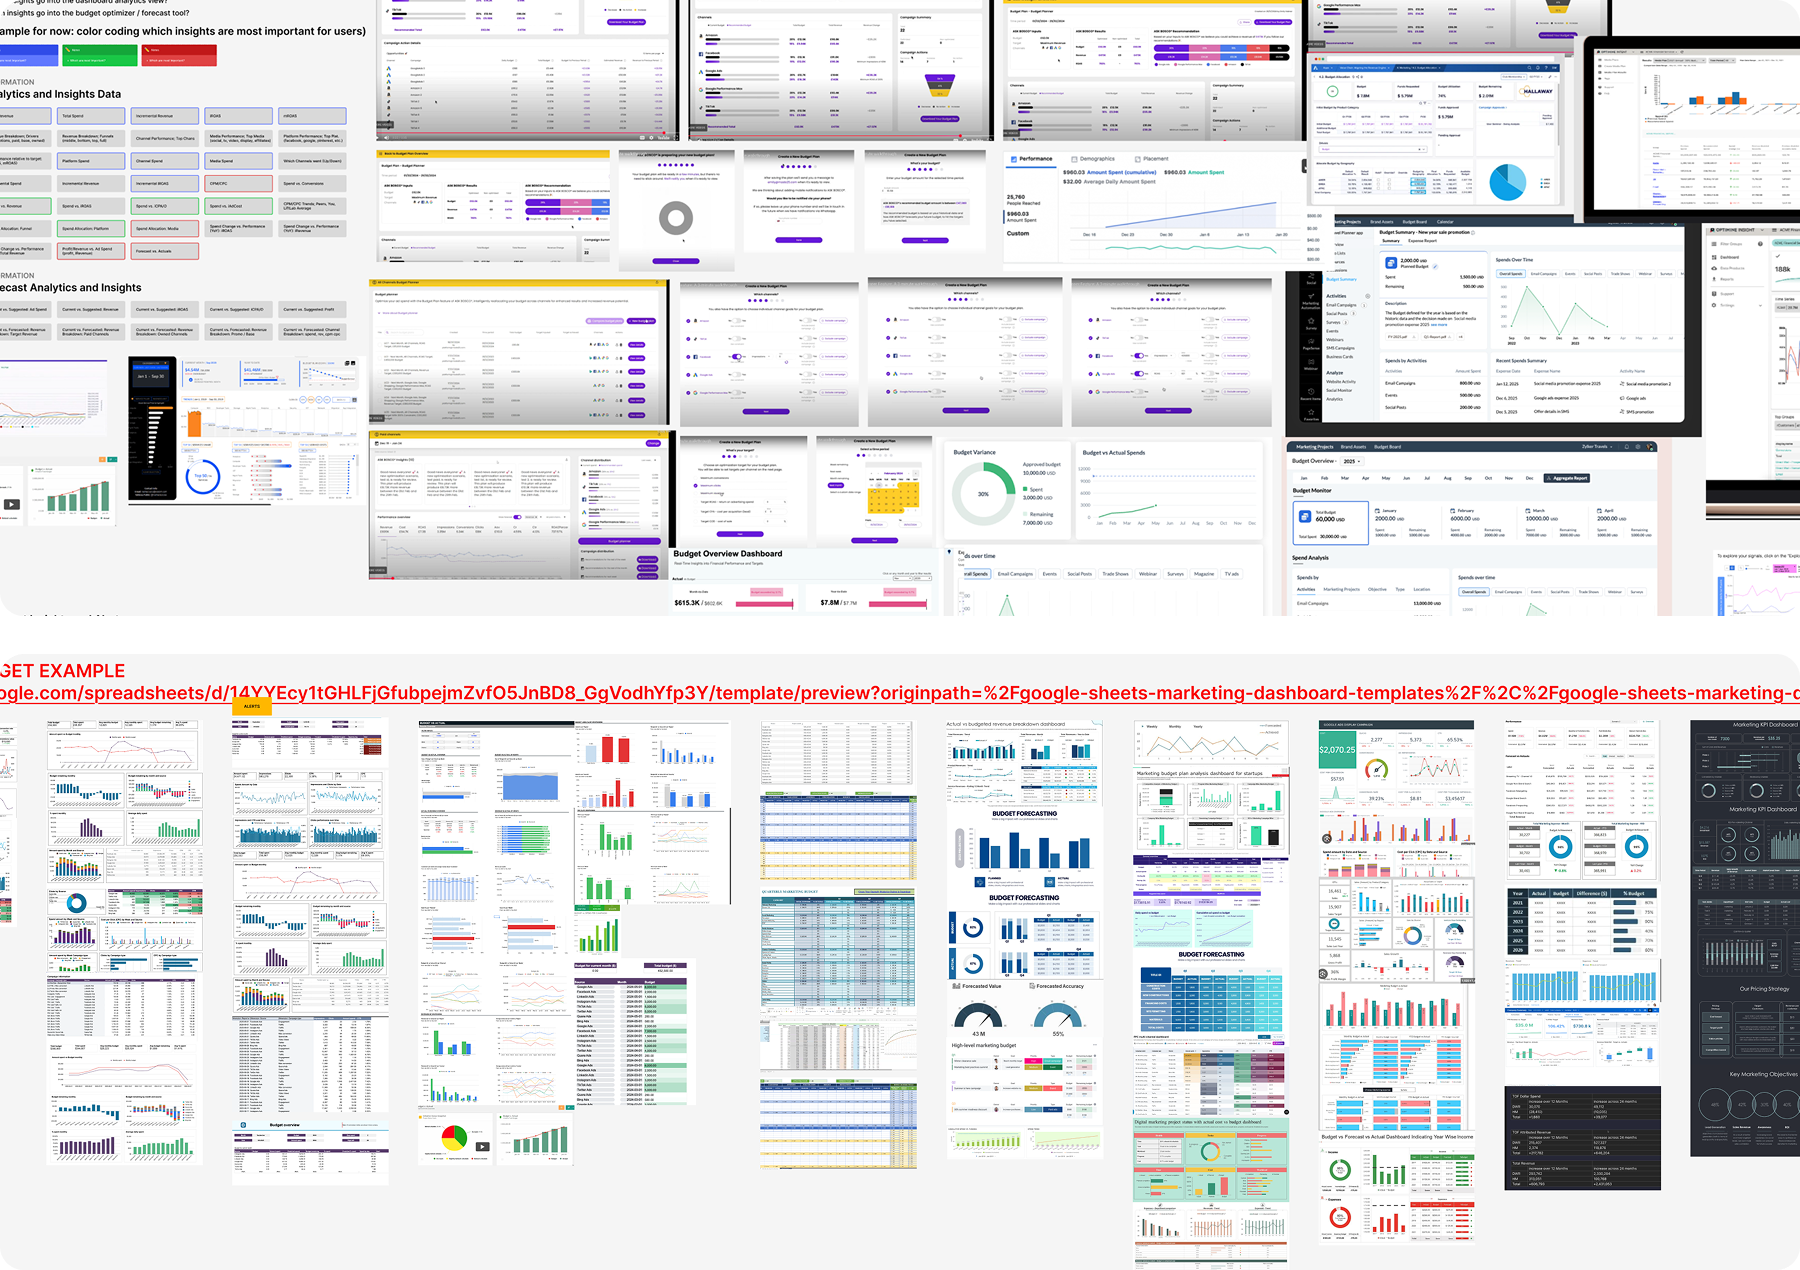
Research and Competitive Analysis

Default Configuration Presets

Forecasting Summary Panel

Recommendations — Historical Data

Default Configuration Presets

Forecasting Summary Panel

Recommendations — Historical Data

Dashboard Wireframe

Dashboard Wireframe

Dashboard Wireframe

Dashboard Wireframes — Analytics Insights

Dashboard Wireframes — Analytics Insights
Measurable results
The redesign delivered measurable impact across accuracy, efficiency, and business value — exceeding all original success targets set at the start of the project.
Forecast Accuracy
Average forecast accuracy rose from 62% to 88% — a 26-point lift that exceeded the project's 20% improvement target and made the product meaningfully more trustworthy.
Budget Creation Speed
Enterprise budget cycles dropped from 3–4 days of manual work to under 4 hours in-app — a 90% reduction in time-to-complete for the primary user workflow.
Adoption Rate
75% of target enterprise clients are now using the forecasting feature monthly, a significant jump from the pre-redesign baseline engagement levels.
Business Impact
Contributed to a 15% lift in average contract value for clients on the premium tier — directly tied to the forecasting redesign during renewal and upsell conversations.